Fig. 8
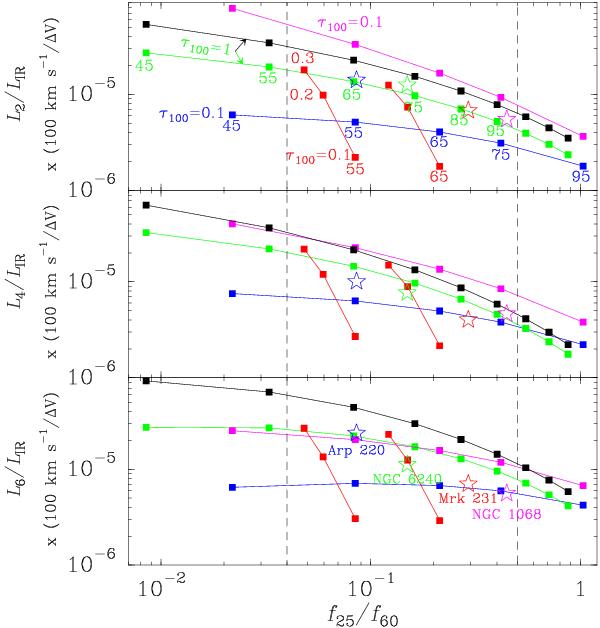
Modeled LH2O/LIR × (100 km s-1/ ΔV) for lines 2 (upper), 4 (middle), and 6 (lower) as a function of the f25/f60 color. The dashed vertical lines indicate the lower and upper limits for f25/f60 measured by Y13. In the upper panel, the small numbers below the squares indicate the value of Tdust , and τ100 is also indicated. Blue squares: NH2O/ ΔV = 1015cm-2/ (km s-1) and τ100 = 0.1; magenta: same as blue symbols but with collisional excitation included with Tgas = 150 K and nH2 = 3 × 105 cm-3; green: NH2O/ΔV = 1015cm-2/ (km s-1) and τ100 = 1.0; black: same as green but with NH2O/ΔV = 5 × 1015cm-2/ (km s-1). Red squares show results for fixed Tdust = 55 and 65 K with NH2O/(ΔVτ100) = 5 × 1015cm-2/ (km s-1) and τ100 = 0.1−0.3. The starred symbols indicate the positions of Arp 220 (blue), NGC 6240 (green), Mrk 231 (red), and NGC 1068 (magenta), as reported by Rangwala et al. (2011), Meijerink et al. (2013), G-A10, and Y13, respectively. When compared with observations, the modeled LIR values should be considered a fraction of the observed IR luminosities (Sect. 4.3.1). If f60 is contaminated by cold dust, the points would move to the left.
Current usage metrics show cumulative count of Article Views (full-text article views including HTML views, PDF and ePub downloads, according to the available data) and Abstracts Views on Vision4Press platform.
Data correspond to usage on the plateform after 2015. The current usage metrics is available 48-96 hours after online publication and is updated daily on week days.
Initial download of the metrics may take a while.