Fig. 6
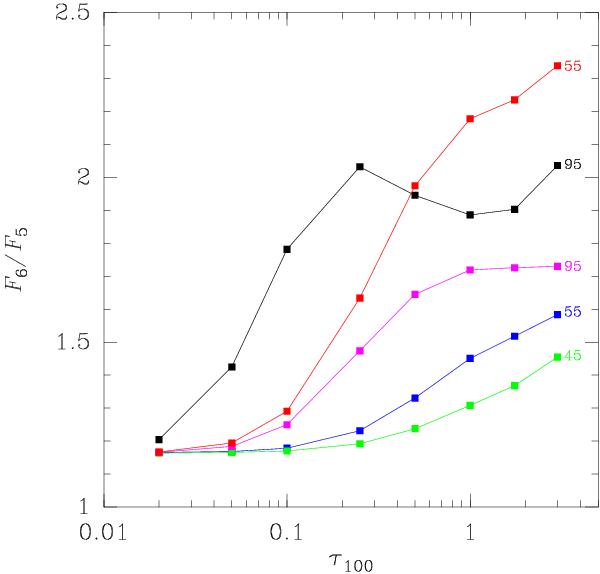
F6/F5 (oH2O 321−312-to-312−303) line flux ratio as a function of τ100. The small numbers on the right side of the curves indicate the values of Tdust for each curve. The H2O column density per unit of velocity interval is NH2O/ΔV = 1015cm-2/ (km s-1) (green, blue, and magenta curves) and NH2O/ΔV = 5 × 1015cm-2/ (km s-1) (red and black curves).
Current usage metrics show cumulative count of Article Views (full-text article views including HTML views, PDF and ePub downloads, according to the available data) and Abstracts Views on Vision4Press platform.
Data correspond to usage on the plateform after 2015. The current usage metrics is available 48-96 hours after online publication and is updated daily on week days.
Initial download of the metrics may take a while.