Fig. 5
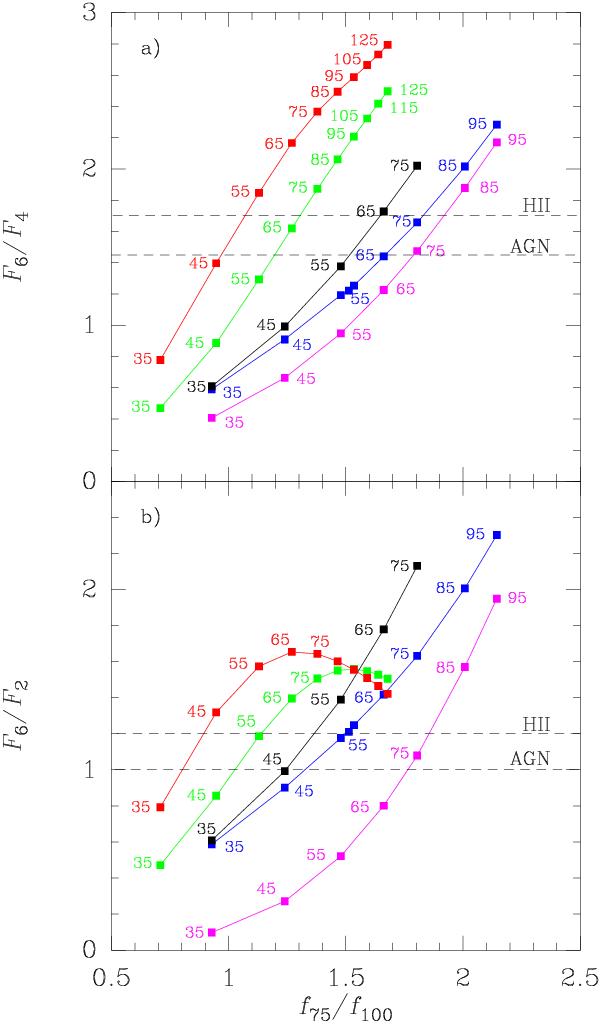
a)F6/F4 (oH2O 321−312-to-pH2O 220−211) and b) F6/F2 (oH2O 321−312-to-pH2O 202−111) line flux ratios as a function of the 75-to-100 μm far-IR color. Blue symbols: NH2O/ΔV = 1015cm-2/ (km s-1) and τ100 ≤ 0.1; black: NH2O/ΔV = 5 × 1015cm-2/ (km s-1) and τ100 ≤ 0.1; red: NH2O/ΔV = 5 × 1015cm-2/ (km s-1) and τ100 = 1.0; green: NH2O/ΔV = 1015cm-2/ (km s-1) and τ100 = 1.0; magenta: same as blue symbols but with collisional excitation included with Tgas = 150 K and nH2 = 3 × 105 cm-3. The small numbers close to the symbols indicate the value of Tdust . The observed averaged ratios for strong-AGN and HII+mild-AGN sources (Y13) are indicated with dashed horizontal lines, and indicate that the regions probed by the H2O submm emission are characterized by warm dust (Tdust ≳ 45 K).
Current usage metrics show cumulative count of Article Views (full-text article views including HTML views, PDF and ePub downloads, according to the available data) and Abstracts Views on Vision4Press platform.
Data correspond to usage on the plateform after 2015. The current usage metrics is available 48-96 hours after online publication and is updated daily on week days.
Initial download of the metrics may take a while.