Fig. 3
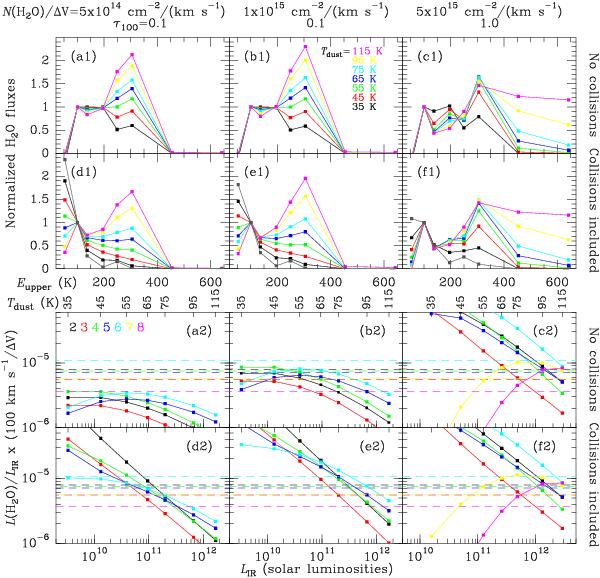
Relevant model results for the normalized H2O SLED (a1)−f1)), and for the LH2O/LIR ratios (for ΔV = 100 kms-1) as a function of Tdust and LIR (assuming a source of Reff = 100 pc, a2)−f2)). In panels a1)–f1), model results for lines 1 to 8 (Table 1) are shown from left to right. Values for NH2O/ΔV and τ100 are indicated at the top of the figure. The different colors in panels a1)−f1) indicate different Tdust , as labeled in b1), while they indicate different lines in panels a2)−f2) (labeled in a2), see Table 1). Models with collisional excitation ignored (a)−c)), and with collisions included for nH2 = 3 × 105 cm-3 and Tgas = 150 K (d)−f)) are shown. The gray lines/symbols in panels d1)−f1) show model results that ignore radiative pumping (i.e., only collisional excitation). Collisional excitation has the overall effect of enhancing the low-lying lines (1 and 2) relative to the others and of increasing the LH2O/LIR ratios of all lines (see text). The dashed lines in panels a2)−f2) indicate the average LH2O/LIR ratios reported by Y13. When compared with observations, the modeled LIR values should be considered a fraction of the observed IR luminosities, because single temperature dust models are unable to reproduce the observed SEDs (Sect. 4.3.1); the H2O submm emission traces warm regions of luminous IR galaxies (see text).
Current usage metrics show cumulative count of Article Views (full-text article views including HTML views, PDF and ePub downloads, according to the available data) and Abstracts Views on Vision4Press platform.
Data correspond to usage on the plateform after 2015. The current usage metrics is available 48-96 hours after online publication and is updated daily on week days.
Initial download of the metrics may take a while.