Fig. 11
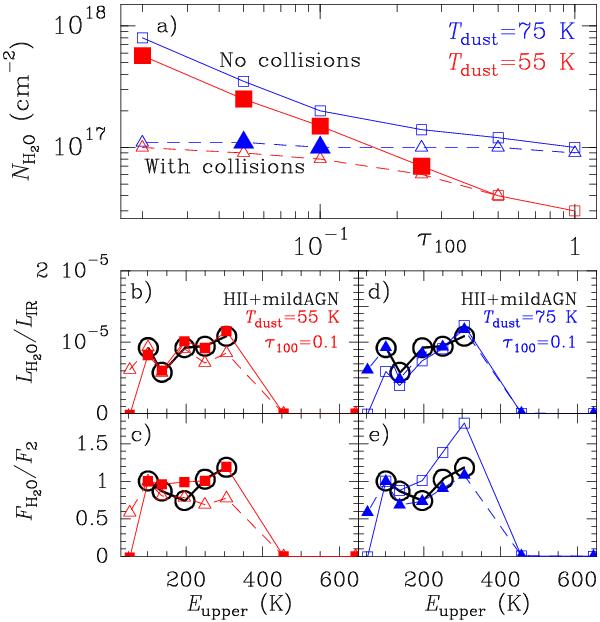
a) Values of NH2O for ΔV = 100 km s-1 as a function of τ100, for Tdust = 55 K (red) and 75 K (blue), required to account for the observed averaged LH2O/LIR ratios in HII-mild AGN sources (as given by Y13). Models both without (squares) and with (triangles) collisional excitation are shown. In the latter models, Tgas = 150 K, and nH2 = 5 × 10⁴−3 × 105 cm-3 for Tdust = 55−75 K, respectively. The large filled symbols indicate the best fit models to the averaged SLED. Panels b)− e) compare in detail the four models with τ100 = 0.1 (both with and without collisions) with the observed values (black circles) in HII-mild AGN sources (both the normalized flux ratios (SLED) and the LH2O/LIR ratios, Y13, for lines 2−6). In panels b) and d), the models indicate the values of LH2O/LIR for ΔV = 100 kms-1. Lines 1, 7, and 8 are excluded from the comparison because of their low detection rates (Y13).
Current usage metrics show cumulative count of Article Views (full-text article views including HTML views, PDF and ePub downloads, according to the available data) and Abstracts Views on Vision4Press platform.
Data correspond to usage on the plateform after 2015. The current usage metrics is available 48-96 hours after online publication and is updated daily on week days.
Initial download of the metrics may take a while.