Fig. 10
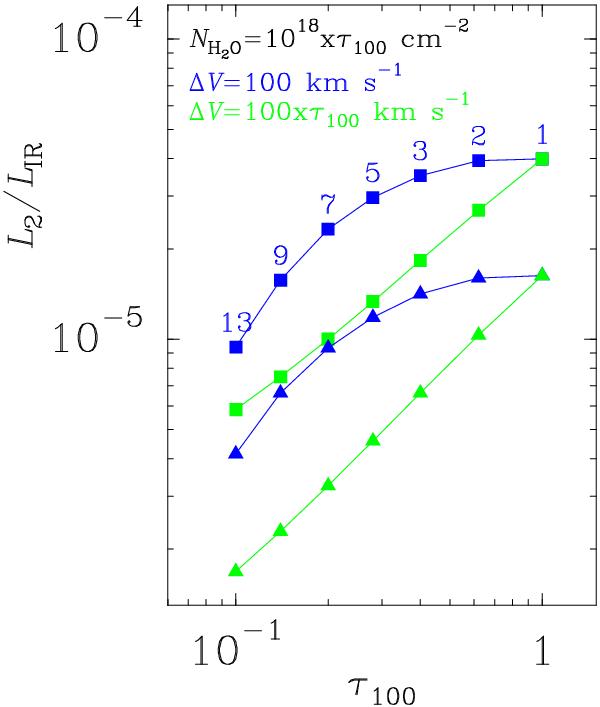
Modeled L2/LIR ratio as a function of τ100. Squares and triangles indicate Tdust = 55 and 75 K, respectively. In all models, collisional excitation is included with Tgas = 150 K and nH2 = 3 × 104 cm-3. NH2O/τ100 = 1018 cm-2 is adopted, corresponding to a constant H2O abundance of 7.7 × 10⁻⁷ (Eq. (1)). Blue symbols indicate models with ΔV = 100 kms-1 and thus with variable Kvir (Eq. (5)) indicated with the numbers. Green symbols show results with ΔV = 100 × τ100 kms-1 simulating a constant value of Kvir = 1.3. When compared with observations, the modeled LIR values should be considered a fraction of the observed IR luminosities (Sect. 4.3.1), and thus the modeled L2/LIR values are upper limits.
Current usage metrics show cumulative count of Article Views (full-text article views including HTML views, PDF and ePub downloads, according to the available data) and Abstracts Views on Vision4Press platform.
Data correspond to usage on the plateform after 2015. The current usage metrics is available 48-96 hours after online publication and is updated daily on week days.
Initial download of the metrics may take a while.