Fig. 1
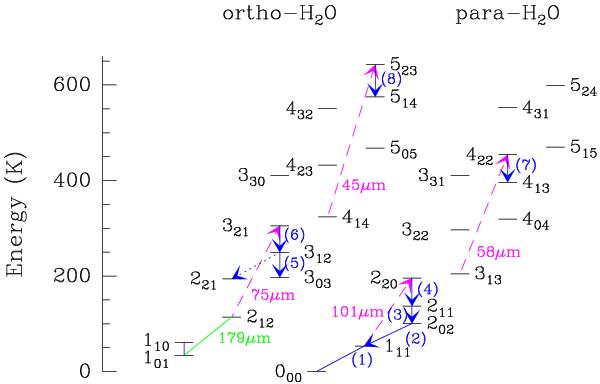
Energy level diagram of H2O, showing the relevant H2O lines at submillimeter wavelengths with blue arrows, and the far-IR H2O pumping (absorption) lines with dashed-magenta arrows. The lines are numbered as listed in Table 1. The o-H2O 312−221 transition is not considered due to blending with CO (10-9) (G-A10), and the far-IR 212−101 transition at 179.5 μm discussed in the text is also indicated in green for completeness.
Current usage metrics show cumulative count of Article Views (full-text article views including HTML views, PDF and ePub downloads, according to the available data) and Abstracts Views on Vision4Press platform.
Data correspond to usage on the plateform after 2015. The current usage metrics is available 48-96 hours after online publication and is updated daily on week days.
Initial download of the metrics may take a while.