Fig. 12
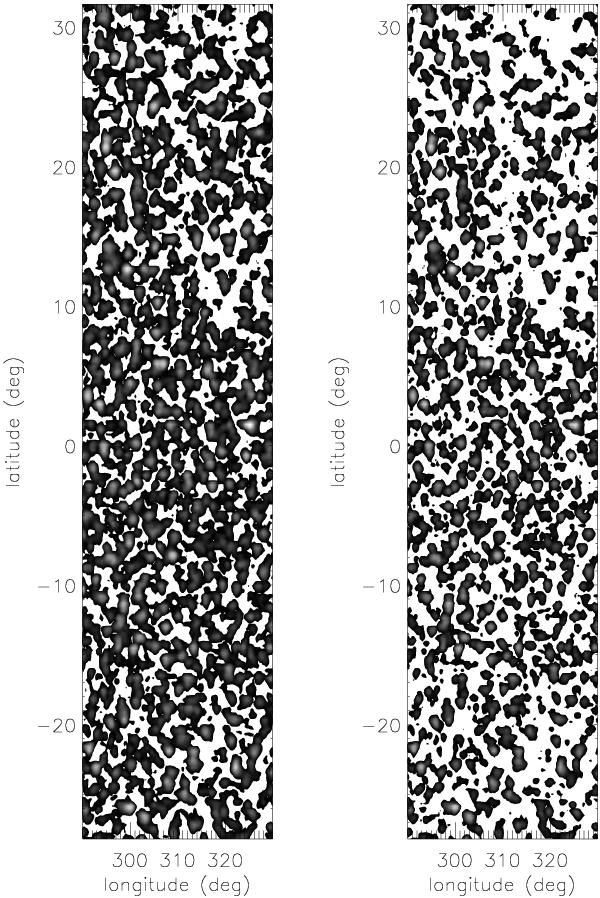
Divergence (larger than 0.0002876 s-1 in each frame) integrated over 7 days of observations (left). Identical plot with values higher than 0.000342 s-1 over the 7 days (right). We note in the right upper corner a lower density of the stronger divergence due to the magnetic activity at that location during the 7 days of the sequence. We also note the same density below a latitude − 20° in the bottom right corner, but the magnetic field was only active for 2 days.
Current usage metrics show cumulative count of Article Views (full-text article views including HTML views, PDF and ePub downloads, according to the available data) and Abstracts Views on Vision4Press platform.
Data correspond to usage on the plateform after 2015. The current usage metrics is available 48-96 hours after online publication and is updated daily on week days.
Initial download of the metrics may take a while.