Fig. 11
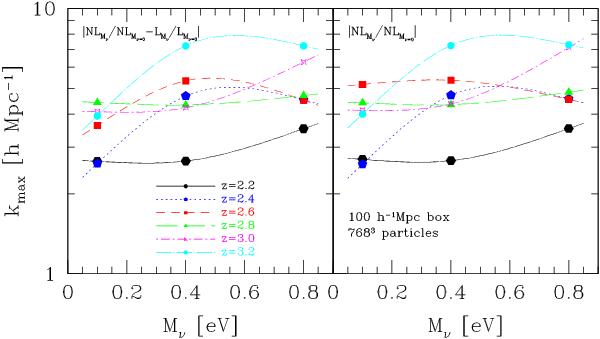
Left: values of k for which the difference between linear and nonlinear evolution in terms of ratios (f) is maximized – without restricting the wavenumber to the one-dimensional BOSS Lyα range. Right: same as the left panel, but when only the nonlinear evolution is considered. This plot is particularly useful because it allows determining which scales are more sensitive to the neutrino mass. See again the main text for more details.
Current usage metrics show cumulative count of Article Views (full-text article views including HTML views, PDF and ePub downloads, according to the available data) and Abstracts Views on Vision4Press platform.
Data correspond to usage on the plateform after 2015. The current usage metrics is available 48-96 hours after online publication and is updated daily on week days.
Initial download of the metrics may take a while.