Free Access
Fig. 6
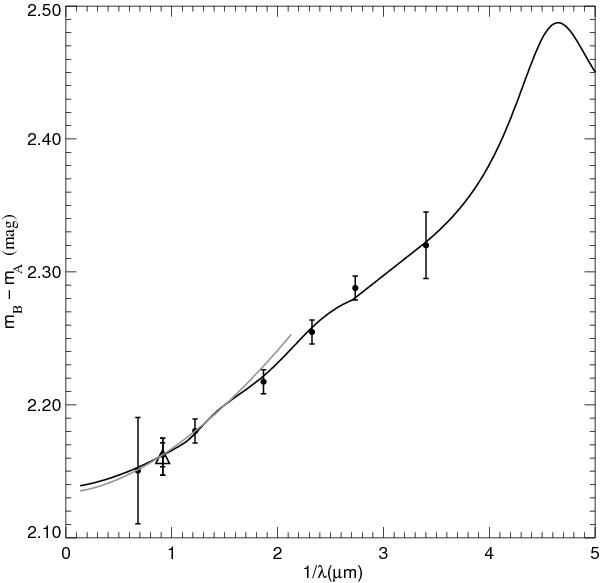
Magnitude difference between components A and B of UM673 as a function of the rest-frame wavelength. The fit to the NIR measurements of the magnitude differences is shown by a grey line, while the fit to the optical-NIR measurements is shown by a black line.
Current usage metrics show cumulative count of Article Views (full-text article views including HTML views, PDF and ePub downloads, according to the available data) and Abstracts Views on Vision4Press platform.
Data correspond to usage on the plateform after 2015. The current usage metrics is available 48-96 hours after online publication and is updated daily on week days.
Initial download of the metrics may take a while.