Free Access
Fig. 4
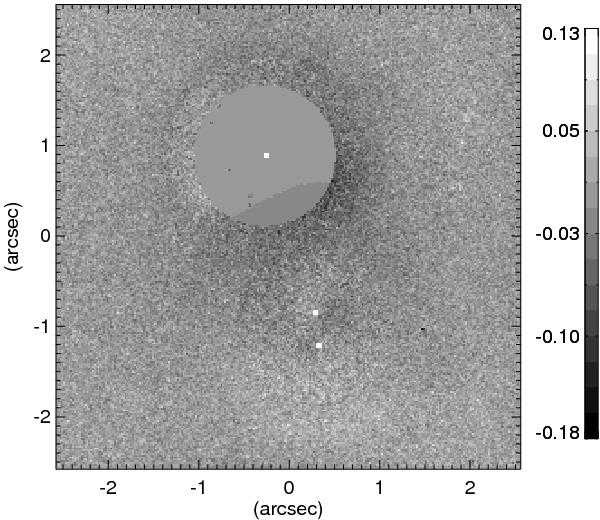
Residuals after subtracting the light of quasar images A and B, and the lensing galaxy. The positions of A, B, and the galaxy centre as calculated from the model are shown by white dots.
Current usage metrics show cumulative count of Article Views (full-text article views including HTML views, PDF and ePub downloads, according to the available data) and Abstracts Views on Vision4Press platform.
Data correspond to usage on the plateform after 2015. The current usage metrics is available 48-96 hours after online publication and is updated daily on week days.
Initial download of the metrics may take a while.