Fig. 3
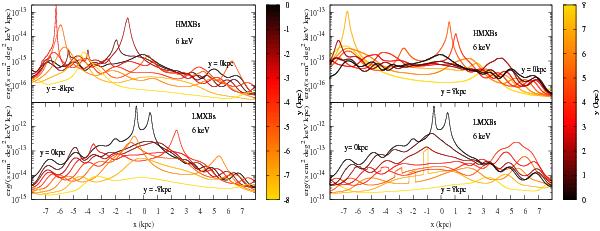
Profiles of the volume emissivity per deg2 in our direction on the Galactic plane due to the observed sources used in our calculations, at different distances from the Galactic center (Sun’s position (−8 kpc, 0, 0.015 kpc)). Units were chosen so that if this emissivity is integrated over 1 kpc it is numerically equal to the observed flux. Proximity effects in the vicinity of sources are clearly visible. The concentration of LMXBs in the Galactic bulge results in a steady decrease in the overall profile of the volume emissivity from these sources away from the Galactic center. This is not the case for HMXBs because of their distribution along the Galactic disk. Discontinuities in the LMXBs profiles in the positive y-range are caused by temporal constraints in the illumination of its surroundings by the very bright source GRS 1915+105 (located at (− 0.27 kpc,7.83 kpc, − 27 pc)), which was not observed during 1970−1992 and is assumed to have been absent before 1992.
Current usage metrics show cumulative count of Article Views (full-text article views including HTML views, PDF and ePub downloads, according to the available data) and Abstracts Views on Vision4Press platform.
Data correspond to usage on the plateform after 2015. The current usage metrics is available 48-96 hours after online publication and is updated daily on week days.
Initial download of the metrics may take a while.