Free Access
Fig. 9
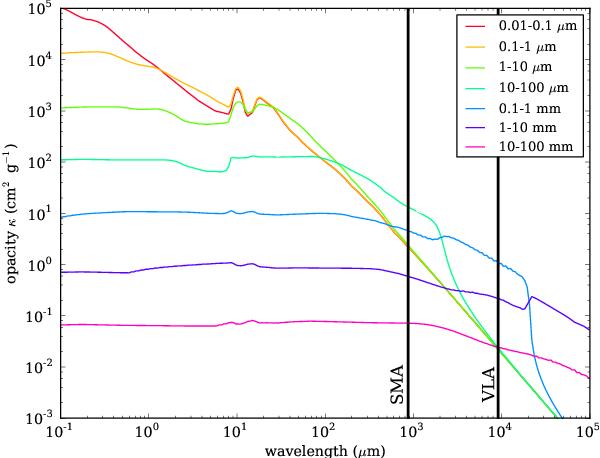
Mass absorption coefficients per order of magnitude in grain size, for an n(a) ∝ a-3.5 size distribution (within each bin). The vertical lines indicate the wavelengths of the SMA and VLA observations, allowing the comparison of the relative opacity contribution for each of the grain size bins.
Current usage metrics show cumulative count of Article Views (full-text article views including HTML views, PDF and ePub downloads, according to the available data) and Abstracts Views on Vision4Press platform.
Data correspond to usage on the plateform after 2015. The current usage metrics is available 48-96 hours after online publication and is updated daily on week days.
Initial download of the metrics may take a while.