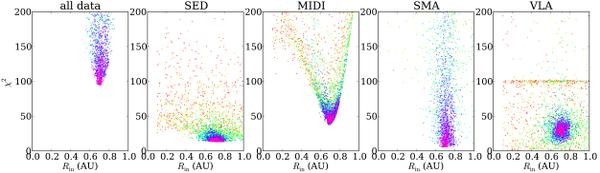
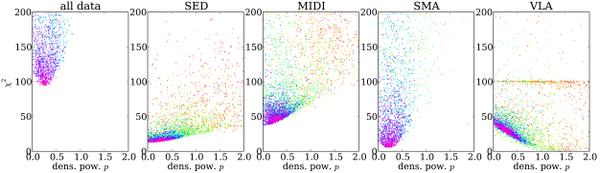
Fig. 8
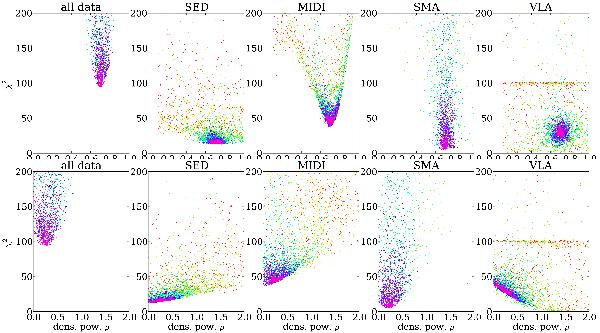
Convergence plots for Rin (top) and the surface density power p (bottom), for the simple-disk model. The titles of the individual plots indicate to which data set the shown χ2 values correspond (e.g., for MIDI:  ). The colors indicate the model generation to which the points correspond (red = first generations; violet = final generations).
Current usage metrics show cumulative count of Article Views (full-text article views including HTML views, PDF and ePub downloads, according to the available data) and Abstracts Views on Vision4Press platform.
Data correspond to usage on the plateform after 2015. The current usage metrics is available 48-96 hours after online publication and is updated daily on week days.
Initial download of the metrics may take a while.