Fig. A.2
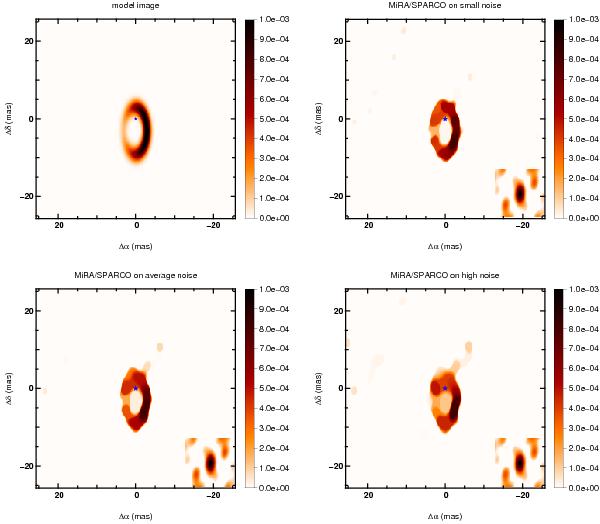
MiRA image reconstructions with SPARCO . The top-left image is the original model image. In the top right we show the reconstruction with the low-photon noise level. In the bottom left corner there is an image reconstruction with the average photon noise level. In the bottom-right corner the reconstruction was made with the high photon noise level. The red star represents the central star in all the images. With this method, the star is not represented in the image as flux in the pixels. In the bottom-right corner of each image the dirty-beam is represented. The dirty-beam is the equivalent of the point spread function in interferometry. It is computed from the (u,v)-plan.


Current usage metrics show cumulative count of Article Views (full-text article views including HTML views, PDF and ePub downloads, according to the available data) and Abstracts Views on Vision4Press platform.
Data correspond to usage on the plateform after 2015. The current usage metrics is available 48-96 hours after online publication and is updated daily on week days.
Initial download of the metrics may take a while.