Fig. 4
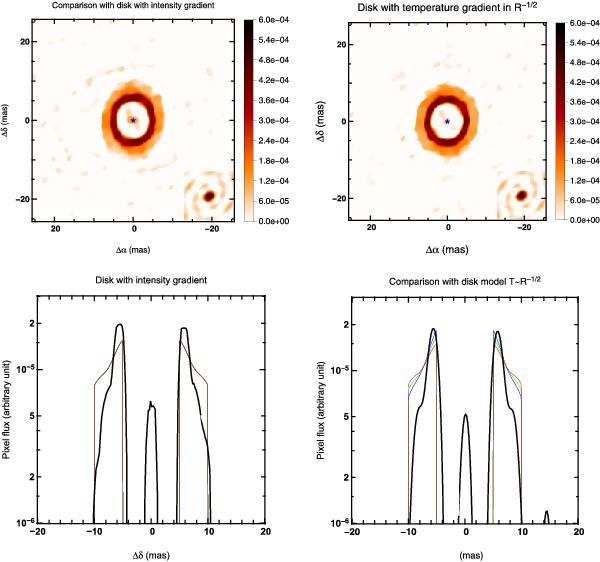
Reconstructions with an intensity gradient in the disk (left) and
a temperature gradient in the disk ∝ (right). The reconstructions have a χ2 ≈ 1.
Bottom: cut of the reconstructed images (black) and of the disk
models. The colors are for the different wavelengths in the right panel
(blue: 1.55
μm, red: 1.8 μm). The flux
level is given on a logarithmic scale.
(right). The reconstructions have a χ2 ≈ 1.
Bottom: cut of the reconstructed images (black) and of the disk
models. The colors are for the different wavelengths in the right panel
(blue: 1.55
μm, red: 1.8 μm). The flux
level is given on a logarithmic scale.

Current usage metrics show cumulative count of Article Views (full-text article views including HTML views, PDF and ePub downloads, according to the available data) and Abstracts Views on Vision4Press platform.
Data correspond to usage on the plateform after 2015. The current usage metrics is available 48-96 hours after online publication and is updated daily on week days.
Initial download of the metrics may take a while.