Fig. 3
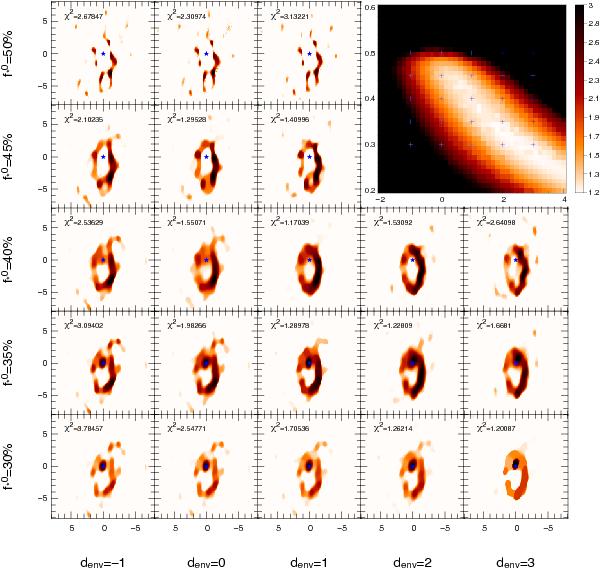
MiRA image reconstructions as a function of the assumed
chromatic parameters: the stellar-to-total-flux ratio
 and the
dust spectral index denv. The star is represented in
red at the center of each image. The true values are
and the
dust spectral index denv. The star is represented in
red at the center of each image. The true values are
 and denv = 1.
Top right: χ2 map of the reconstructions as a
function of the chromatic parameters for reconstructions with the total variation
regularization. All χ2sup3 are represented in black.
The blue crosses represent the location of the images in the χ2 map. We
can clearly see that this map is degenerated.
and denv = 1.
Top right: χ2 map of the reconstructions as a
function of the chromatic parameters for reconstructions with the total variation
regularization. All χ2sup3 are represented in black.
The blue crosses represent the location of the images in the χ2 map. We
can clearly see that this map is degenerated.
Current usage metrics show cumulative count of Article Views (full-text article views including HTML views, PDF and ePub downloads, according to the available data) and Abstracts Views on Vision4Press platform.
Data correspond to usage on the plateform after 2015. The current usage metrics is available 48-96 hours after online publication and is updated daily on week days.
Initial download of the metrics may take a while.