Fig. D.1
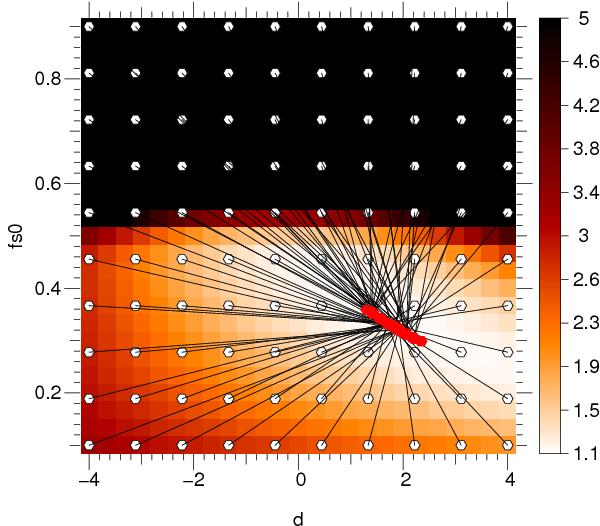
χ2 map with the fit departures and
arrivals for the model. The color represent the χ2 for
every pair of chromatic parameters  and
denv. The white dots are the
starting pair for image reconstructions. The red points represent the found
parameters for the final image. The fit always ends in the χ2 minimum
but far from the correct values (
and
denv. The white dots are the
starting pair for image reconstructions. The red points represent the found
parameters for the final image. The fit always ends in the χ2 minimum
but far from the correct values ( and denv = 1).
The black solid lines link the start and the final values of one reconstruction.
and denv = 1).
The black solid lines link the start and the final values of one reconstruction.
Current usage metrics show cumulative count of Article Views (full-text article views including HTML views, PDF and ePub downloads, according to the available data) and Abstracts Views on Vision4Press platform.
Data correspond to usage on the plateform after 2015. The current usage metrics is available 48-96 hours after online publication and is updated daily on week days.
Initial download of the metrics may take a while.