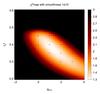
Fig. B.2
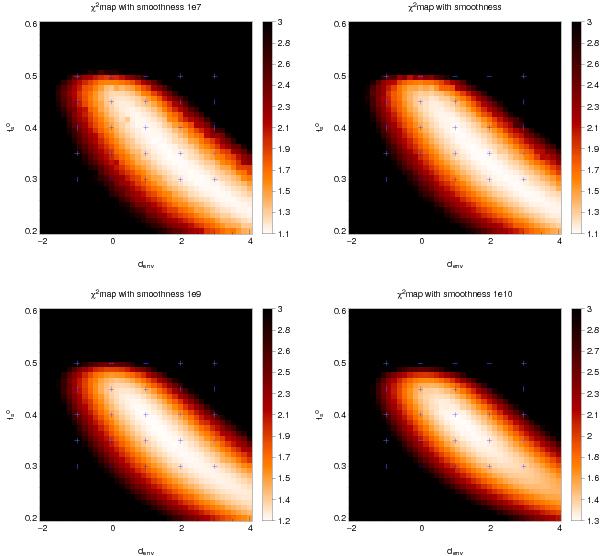
Choice of the μ parameter and its influence on the fit of the chromatic parameters. χ2 map of the reconstructions as a function of the chromatic parameters for reconstructions with the smoothness regularization. Black represents χ2> 3. The blue crosses represent the location of the images of Fig. 3 in the χ2 map. The four figures represent μ = { 107,108,109,1010 } respectively. The χ2 does not change significantly with the μ hyper-parameter, but the degeneracy is always strong.
Current usage metrics show cumulative count of Article Views (full-text article views including HTML views, PDF and ePub downloads, according to the available data) and Abstracts Views on Vision4Press platform.
Data correspond to usage on the plateform after 2015. The current usage metrics is available 48-96 hours after online publication and is updated daily on week days.
Initial download of the metrics may take a while.