Fig. 7
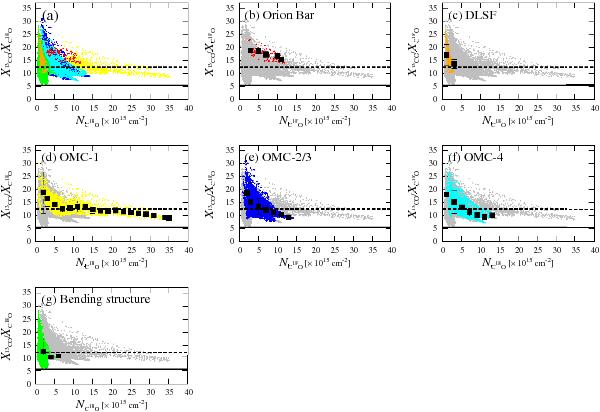
NC18O vs.
 /XC18O measured in
a) the entire region; b) the Orion Bar; c)
DLSF, d) OMC-1; e) OMC-2/3; f) OMC-4;
and g) bending structure area, respectively. The gray, red, orange,
yellow, blue, aqua, and green plots are taken from the entire region, data points in
the Orion bar, DLSF, OMC-1, OMC-2/3, OMC-4, and bending structure, respectively. The
black lines indicate /XC18O = 5.5. The dashed
lines indicate /X,C18O=
12.3, which is the mean value of /XC18O for the entire
region. The filled squares show the mean /XC18O which is computed
by binning the individually calculated ratios into intervals of 2.0 × 10¹⁵
cm-2. The
error bars show the standard deviations in each bin.
/XC18O measured in
a) the entire region; b) the Orion Bar; c)
DLSF, d) OMC-1; e) OMC-2/3; f) OMC-4;
and g) bending structure area, respectively. The gray, red, orange,
yellow, blue, aqua, and green plots are taken from the entire region, data points in
the Orion bar, DLSF, OMC-1, OMC-2/3, OMC-4, and bending structure, respectively. The
black lines indicate /XC18O = 5.5. The dashed
lines indicate /X,C18O=
12.3, which is the mean value of /XC18O for the entire
region. The filled squares show the mean /XC18O which is computed
by binning the individually calculated ratios into intervals of 2.0 × 10¹⁵
cm-2. The
error bars show the standard deviations in each bin.
Current usage metrics show cumulative count of Article Views (full-text article views including HTML views, PDF and ePub downloads, according to the available data) and Abstracts Views on Vision4Press platform.
Data correspond to usage on the plateform after 2015. The current usage metrics is available 48-96 hours after online publication and is updated daily on week days.
Initial download of the metrics may take a while.