Fig. 5
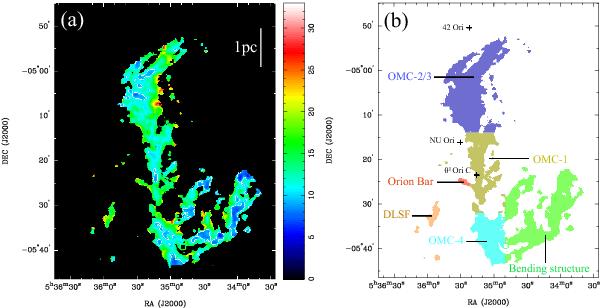
a) Map of the abundance ratio  /XC18O. b)
Locations of the regions summarized in Table 4. Colors to indicate the individual regions are the same as those of the
plots in Fig. 6. In panel a), the
contours show the value of /XC18O = 10. The crosses
show the positions of θ1 Ori C, NU Ori, and 42 Ori,
which are the exciting stars of the HII regions, M 42, M 43, and NGC 1977.
/XC18O. b)
Locations of the regions summarized in Table 4. Colors to indicate the individual regions are the same as those of the
plots in Fig. 6. In panel a), the
contours show the value of /XC18O = 10. The crosses
show the positions of θ1 Ori C, NU Ori, and 42 Ori,
which are the exciting stars of the HII regions, M 42, M 43, and NGC 1977.
Current usage metrics show cumulative count of Article Views (full-text article views including HTML views, PDF and ePub downloads, according to the available data) and Abstracts Views on Vision4Press platform.
Data correspond to usage on the plateform after 2015. The current usage metrics is available 48-96 hours after online publication and is updated daily on week days.
Initial download of the metrics may take a while.