Fig. 4
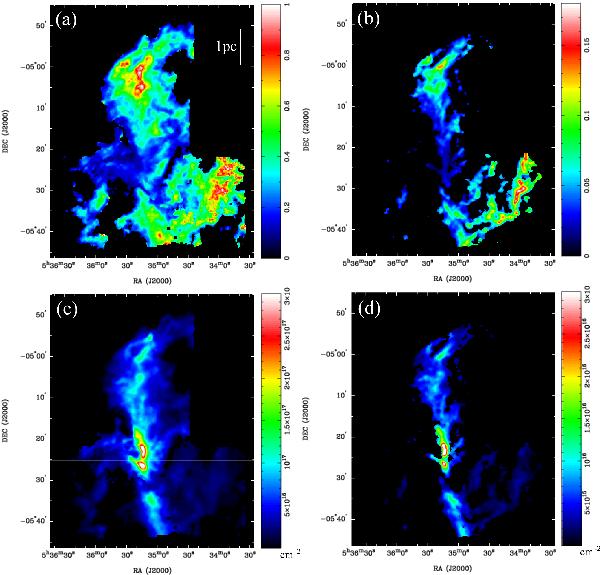
Maps of the optical depths of the a) 13CO (J = 1–0) and b) C18O (J = 1–0) emission lines, and maps of the column densities of c) 13CO and d) C18O molecules. The optical depths and column densities are estimated on the assumption that the excitation temperatures of the 13CO and C18O (J = 1–0) lines are equal to the peak temperatures of the 12CO (J = 1–0) emission in TMB and are calculated for pixels with intensities above the 8σ noise levels.
Current usage metrics show cumulative count of Article Views (full-text article views including HTML views, PDF and ePub downloads, according to the available data) and Abstracts Views on Vision4Press platform.
Data correspond to usage on the plateform after 2015. The current usage metrics is available 48-96 hours after online publication and is updated daily on week days.
Initial download of the metrics may take a while.