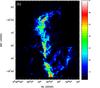
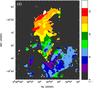
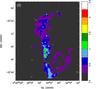
Fig. 2
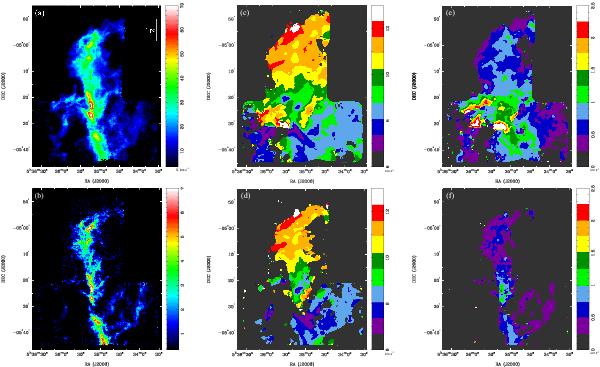
Total intensity maps of the a) 13CO (J = 1–0); and b) C18O (J = 1–0) emission lines integrated over the velocity range 4.25 <VLSR< 14.25 km s-1 in units of K km s-1 (TMB). The other panels are the mean velocity maps of c) 13CO and d) C18O in units of km s-1, and the velocity dispersion maps of e) 13CO; and f) C18O in units of km s-1 calculated for the same velocity range for the total intensity maps. The 13CO and C18O data in FITS format are available at the NRO web page via http://www.nro.nao.ac.jp/~nro45mrt/html/results/data.html and at the CDS.
Current usage metrics show cumulative count of Article Views (full-text article views including HTML views, PDF and ePub downloads, according to the available data) and Abstracts Views on Vision4Press platform.
Data correspond to usage on the plateform after 2015. The current usage metrics is available 48-96 hours after online publication and is updated daily on week days.
Initial download of the metrics may take a while.