Fig. 1
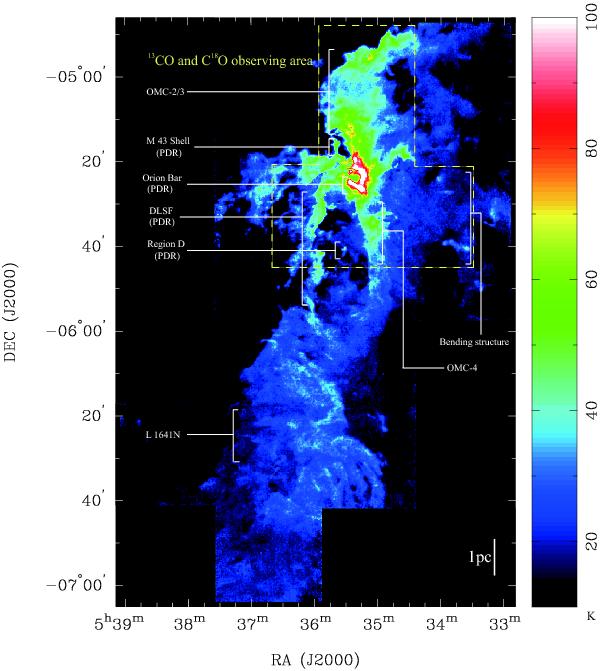
Peak intensity map in the 12CO (J = 1–0) line in units of K (TMB). The data are from Shimajiri et al. (2011) and Nakamura et al. (2012). A dashed box shows the 13CO (J = 1–0) and C18O (J = 1–0) observing region. The 12CO data in FITS format are available at the NRO web page via http://www.nro.nao.ac.jp/~nro45mrt/html/results/data.html and at the CDS.
Current usage metrics show cumulative count of Article Views (full-text article views including HTML views, PDF and ePub downloads, according to the available data) and Abstracts Views on Vision4Press platform.
Data correspond to usage on the plateform after 2015. The current usage metrics is available 48-96 hours after online publication and is updated daily on week days.
Initial download of the metrics may take a while.