Fig. 1
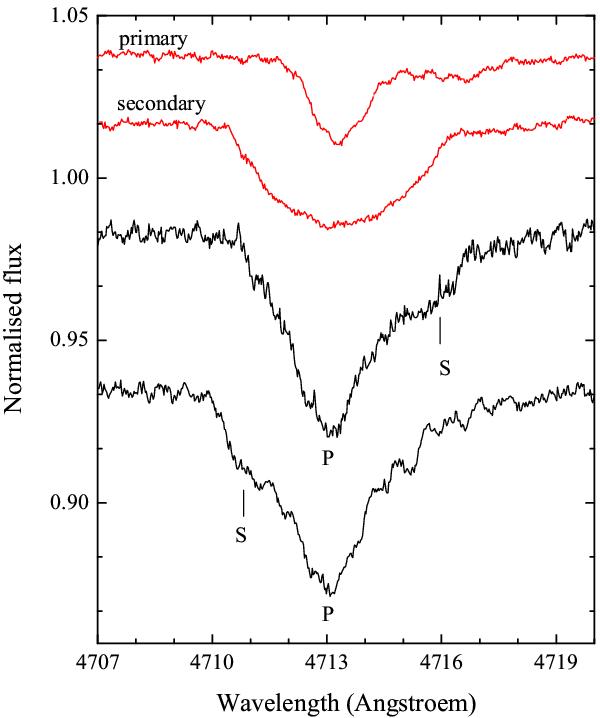
Bottom (black curves): examples of two spectra (#1 and #16) of the He i line at 4713 Å obtained at two different phases of the orbital period. The two binary components are indicated (P and S). Top (red curves): disentangled spectra of the He i line at 4713 Å for the primary and secondary components. All spectra are shifted vertically to allow for a better reading.
Current usage metrics show cumulative count of Article Views (full-text article views including HTML views, PDF and ePub downloads, according to the available data) and Abstracts Views on Vision4Press platform.
Data correspond to usage on the plateform after 2015. The current usage metrics is available 48-96 hours after online publication and is updated daily on week days.
Initial download of the metrics may take a while.