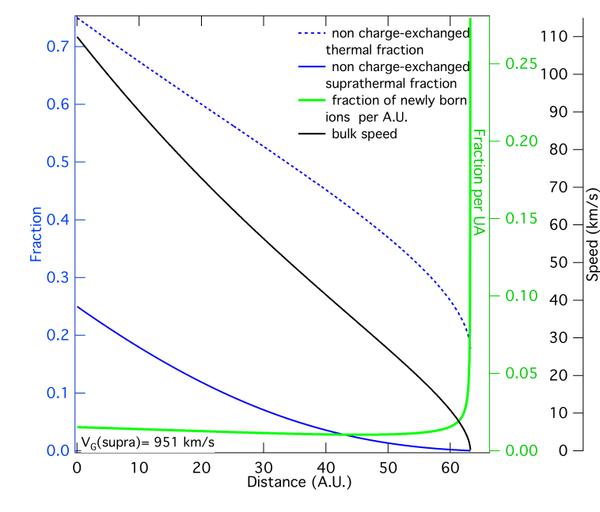
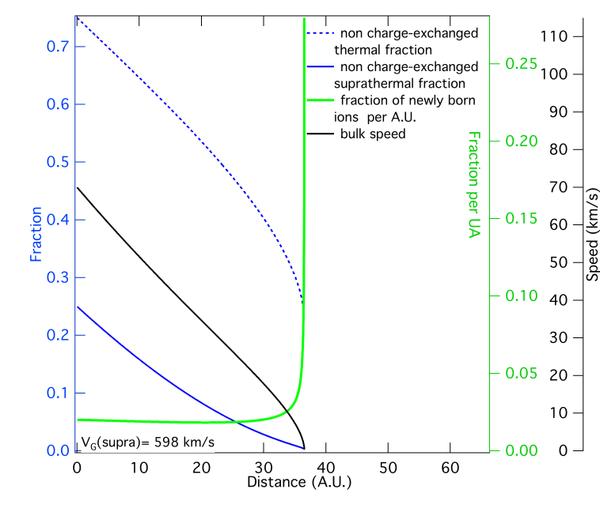
Fig. 7
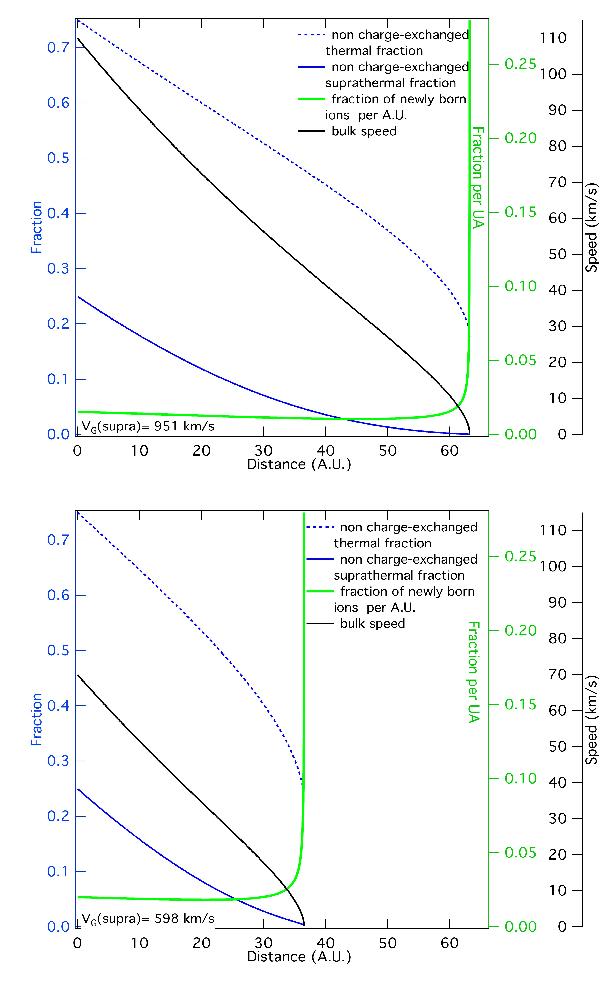
Top: example of evolution of a flow undergoing CE reactions only. Energetic ions (dashed blue curve) are experiencing the largest amount of CEs due to their large individual speed. Beyond 40 UA, they have almost all been trans-charged for only about half of the ambient ions (blue curve). When the flow is decelerated down to about 5−10 km s-1 (black curve), the CE rate increases exponentially and the fraction of particles reacting with the neutrals becomes a significant fraction of the plasma, implying a very strong mixing of the two gases through CE (green curve). Here, V = 110 km s-1, T = 3 × 10⁵ K, APUI = 0.25, nH = 0.21 cm-3, and VH = 26.3 km s-1. Bottom: same figure for V = 70 km s-1.
Current usage metrics show cumulative count of Article Views (full-text article views including HTML views, PDF and ePub downloads, according to the available data) and Abstracts Views on Vision4Press platform.
Data correspond to usage on the plateform after 2015. The current usage metrics is available 48-96 hours after online publication and is updated daily on week days.
Initial download of the metrics may take a while.