Fig. 5
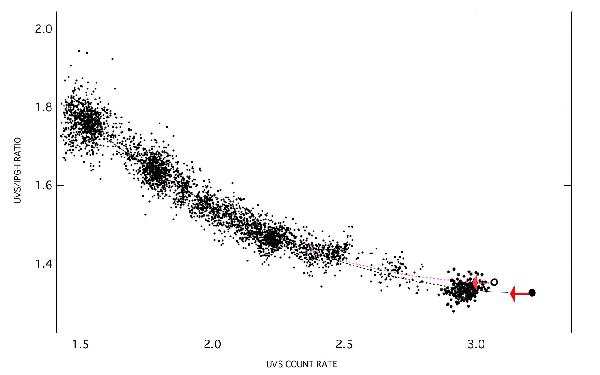
Same as Fig. 3 (main curve), excluding post-jump data except those being corrected for anisotropies based on Fig. 4. The discontinuity has now disappeared. Hypothetical minima deduced from the polynomial fit of Fig. 3 and from a new one one including the post-jump corrected data are marked by filled and empty circles respectively (see text).
Current usage metrics show cumulative count of Article Views (full-text article views including HTML views, PDF and ePub downloads, according to the available data) and Abstracts Views on Vision4Press platform.
Data correspond to usage on the plateform after 2015. The current usage metrics is available 48-96 hours after online publication and is updated daily on week days.
Initial download of the metrics may take a while.