Fig. 2
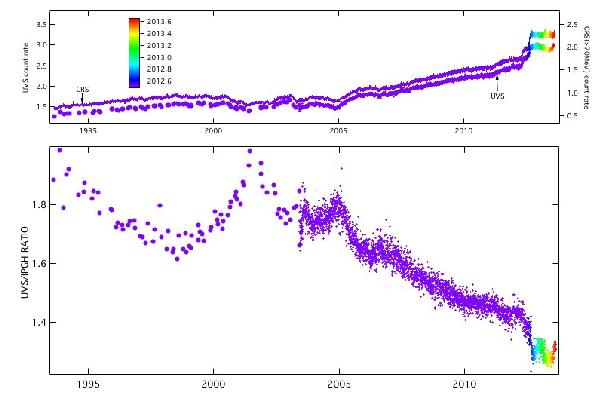
Comparison between the UVS background signal and the CRS count rate for protons above 70 MeV (hereafter IPGH), since 1992 (top). The color scale refers to time, and serves to separate pre- and post-jump data and to allow comparisons to Fig. 3. The two signals, although being fully independent measurements, are strikingly similar, allowing informative comparisons. Their ratio is displayed as a function of time (bottom panel). The global decrease and the temporary increases around the 1999−2003 solar maximum show that the energy range for UVS is globally higher than for the IPGH channel.
Current usage metrics show cumulative count of Article Views (full-text article views including HTML views, PDF and ePub downloads, according to the available data) and Abstracts Views on Vision4Press platform.
Data correspond to usage on the plateform after 2015. The current usage metrics is available 48-96 hours after online publication and is updated daily on week days.
Initial download of the metrics may take a while.