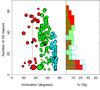
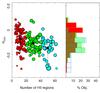
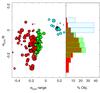
Fig. 7

Left panel: number of detected H ii regions as a function of the inclination of the galaxy. The colors of the symbols and the corresponding histogram indicate the inclination of the galaxies: (i) less than 45° (red); (ii) between 45° and 65° (green); and (iii) larger than 65° (blue). Central panel: slope of the gradients of the oxygen abundance derived for each galaxy as a function of the number of detected H ii regions. The colors of the symbols and the corresponding histogram indicate the number of detected H ii regions in each galaxy: (i) fewer than 20 H ii regions (red); (ii) between 20 and 40 H ii regions (green); and (iii) more than 40 H ii regions (blue). Right panel: slope of the gradients of the oxygen abundance derived for each galaxy based on the linear regression of the radial distribution along the slope derived by comparing the range of abundances with the corresponding range of radial distances. The colors of the symbols and the corresponding histogram indicate this parameter, showing (i) slopes lower than than −0.25 dex/re (red); (ii) between −0.25 and 0.05 dex/re (green); and (iii) larger than 0.05 dex/re (blue). The size of the symbols are inversely proportional to the derived error in the slope of the abundance gradient, in both panels. The black solid diamonds represent the mean values for the different selected subsamples, with the error bars indicating the standard deviation around this mean value.
Current usage metrics show cumulative count of Article Views (full-text article views including HTML views, PDF and ePub downloads, according to the available data) and Abstracts Views on Vision4Press platform.
Data correspond to usage on the plateform after 2015. The current usage metrics is available 48-96 hours after online publication and is updated daily on week days.
Initial download of the metrics may take a while.