Fig. B.1
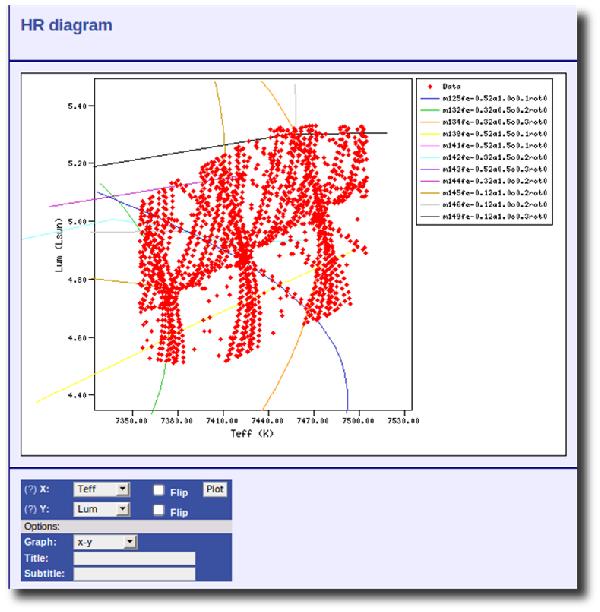
Illustration of a Herzprung-Russel diagram of the models matching all the input criteria simultaneously. Dots represent the effective temperature and luminosity of all the valid models. Lines represent evolutionary tracks. For clarity, only some of the models used in this work are depicted. A color version of the plot is accessible in the online version of the paper. (This figure is available in color in electronic form.)
Current usage metrics show cumulative count of Article Views (full-text article views including HTML views, PDF and ePub downloads, according to the available data) and Abstracts Views on Vision4Press platform.
Data correspond to usage on the plateform after 2015. The current usage metrics is available 48-96 hours after online publication and is updated daily on week days.
Initial download of the metrics may take a while.