Fig. 2
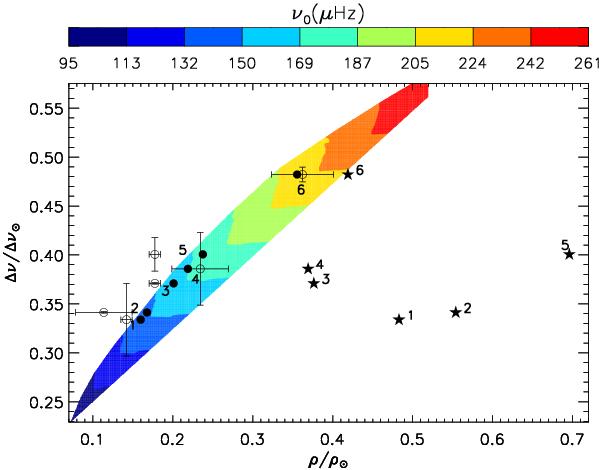
Predicted large separation as a function of the mean density of the star, normalized
to their solar values, Δν⊙ = 134.8 μHz
(Kjeldsen et al. 2008) and
 (Haynes et al. 2012), respectively. Contours
in grey scale indicate the predicted frequency of the fundamental radial mode. Filled
dots, empty dots, and star symbols represent mean densities found in this work, in the
literature, and using Tingley’s calibration, respectively. Stars are labeled as in
Table 2. For the sake of clarity, the error
bars in star symbol estimates are omitted, since they are larger than the abscissa
range. Colors are only available in the online version of the paper. (This figure is
available in color in electronic form.)
(Haynes et al. 2012), respectively. Contours
in grey scale indicate the predicted frequency of the fundamental radial mode. Filled
dots, empty dots, and star symbols represent mean densities found in this work, in the
literature, and using Tingley’s calibration, respectively. Stars are labeled as in
Table 2. For the sake of clarity, the error
bars in star symbol estimates are omitted, since they are larger than the abscissa
range. Colors are only available in the online version of the paper. (This figure is
available in color in electronic form.)
Current usage metrics show cumulative count of Article Views (full-text article views including HTML views, PDF and ePub downloads, according to the available data) and Abstracts Views on Vision4Press platform.
Data correspond to usage on the plateform after 2015. The current usage metrics is available 48-96 hours after online publication and is updated daily on week days.
Initial download of the metrics may take a while.