Fig. 3
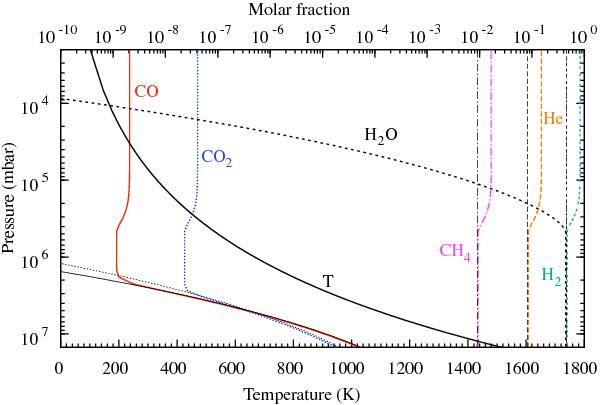
Molar fraction profiles in the troposphere of Uranus obtained with the model of Venot et al. (2012), targeting the 2.1 × 10⁻⁹ upper limit on the upper tropospheric CO mole fraction obtained by Teanby & Irwin (2013). The temperature profile in the troposphere is shown with a solid black line. Thermochemical equilibrium profiles are plotted in black with the same layout as their corresponding species. CO and CO2 are quenched around 2−3 × 10⁶ mbar. H2O departs from thermochemical equilibrium because of condensation and causes an increase of other species mole fractions (the sum of all mole fractions is normalized to unity at all levels). The model parameters are: O/H = 501⊙, C/H = 18⊙, and Kzz = 108 cm2 s-1.
Current usage metrics show cumulative count of Article Views (full-text article views including HTML views, PDF and ePub downloads, according to the available data) and Abstracts Views on Vision4Press platform.
Data correspond to usage on the plateform after 2015. The current usage metrics is available 48-96 hours after online publication and is updated daily on week days.
Initial download of the metrics may take a while.