Fig. 2
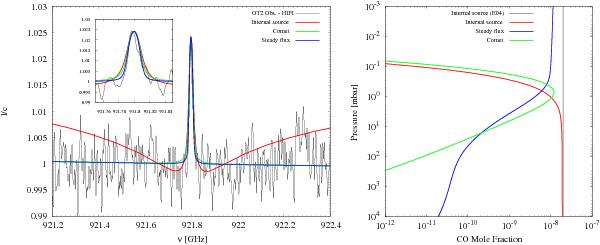
Left: Herschel-HIFI observation of the CO(8−7) line in Uranus on June 15, 2012, expressed in terms of line-to-continuum ratio (l/c, black line). For each source, the models that best fit the emission core are displayed: an internal source yielding a mole fraction of 1.9 × 10⁻⁸ in the upper troposphere (red line), a steady external flux (due to IDP or a local source) of 2.2 × 105 cm-2 s-1 (blue line), and a comet with a diameter of 640 m depositing 3.4 × 10¹³ g of CO above the 0.1 mbar level ~300 years ago (green line). These models were computed with the thermal profile of Feuchtgruber et al. (2013). The internal source model overestimates the line core width and produces a broad absorption that is not observed in the data. The external source models can barely be differentiated. Right: vertical profiles associated with the spectra.
Current usage metrics show cumulative count of Article Views (full-text article views including HTML views, PDF and ePub downloads, according to the available data) and Abstracts Views on Vision4Press platform.
Data correspond to usage on the plateform after 2015. The current usage metrics is available 48-96 hours after online publication and is updated daily on week days.
Initial download of the metrics may take a while.