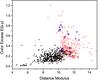
Fig. 3
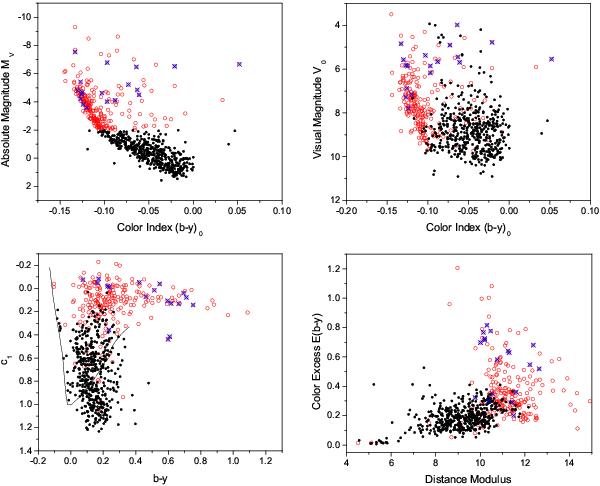
Photometric diagrams MV vs. (b − y)0, V0 vs. (b − y)0 and c1 vs. b − y. The color excess E(b − y) vs. DM is shown in the last panel. Symbols are the same as in Fig. 1: intrinsically bright stars with MV < − 2 mag are marked by red open circles, stars intrinsically fainter than − 2 mag by black filled circles, stars from the classical Cen OB1 association by blue ×-symbols. See the electronic edition for a color version of the figure.
Current usage metrics show cumulative count of Article Views (full-text article views including HTML views, PDF and ePub downloads, according to the available data) and Abstracts Views on Vision4Press platform.
Data correspond to usage on the plateform after 2015. The current usage metrics is available 48-96 hours after online publication and is updated daily on week days.
Initial download of the metrics may take a while.