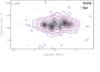
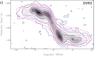
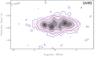
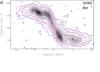
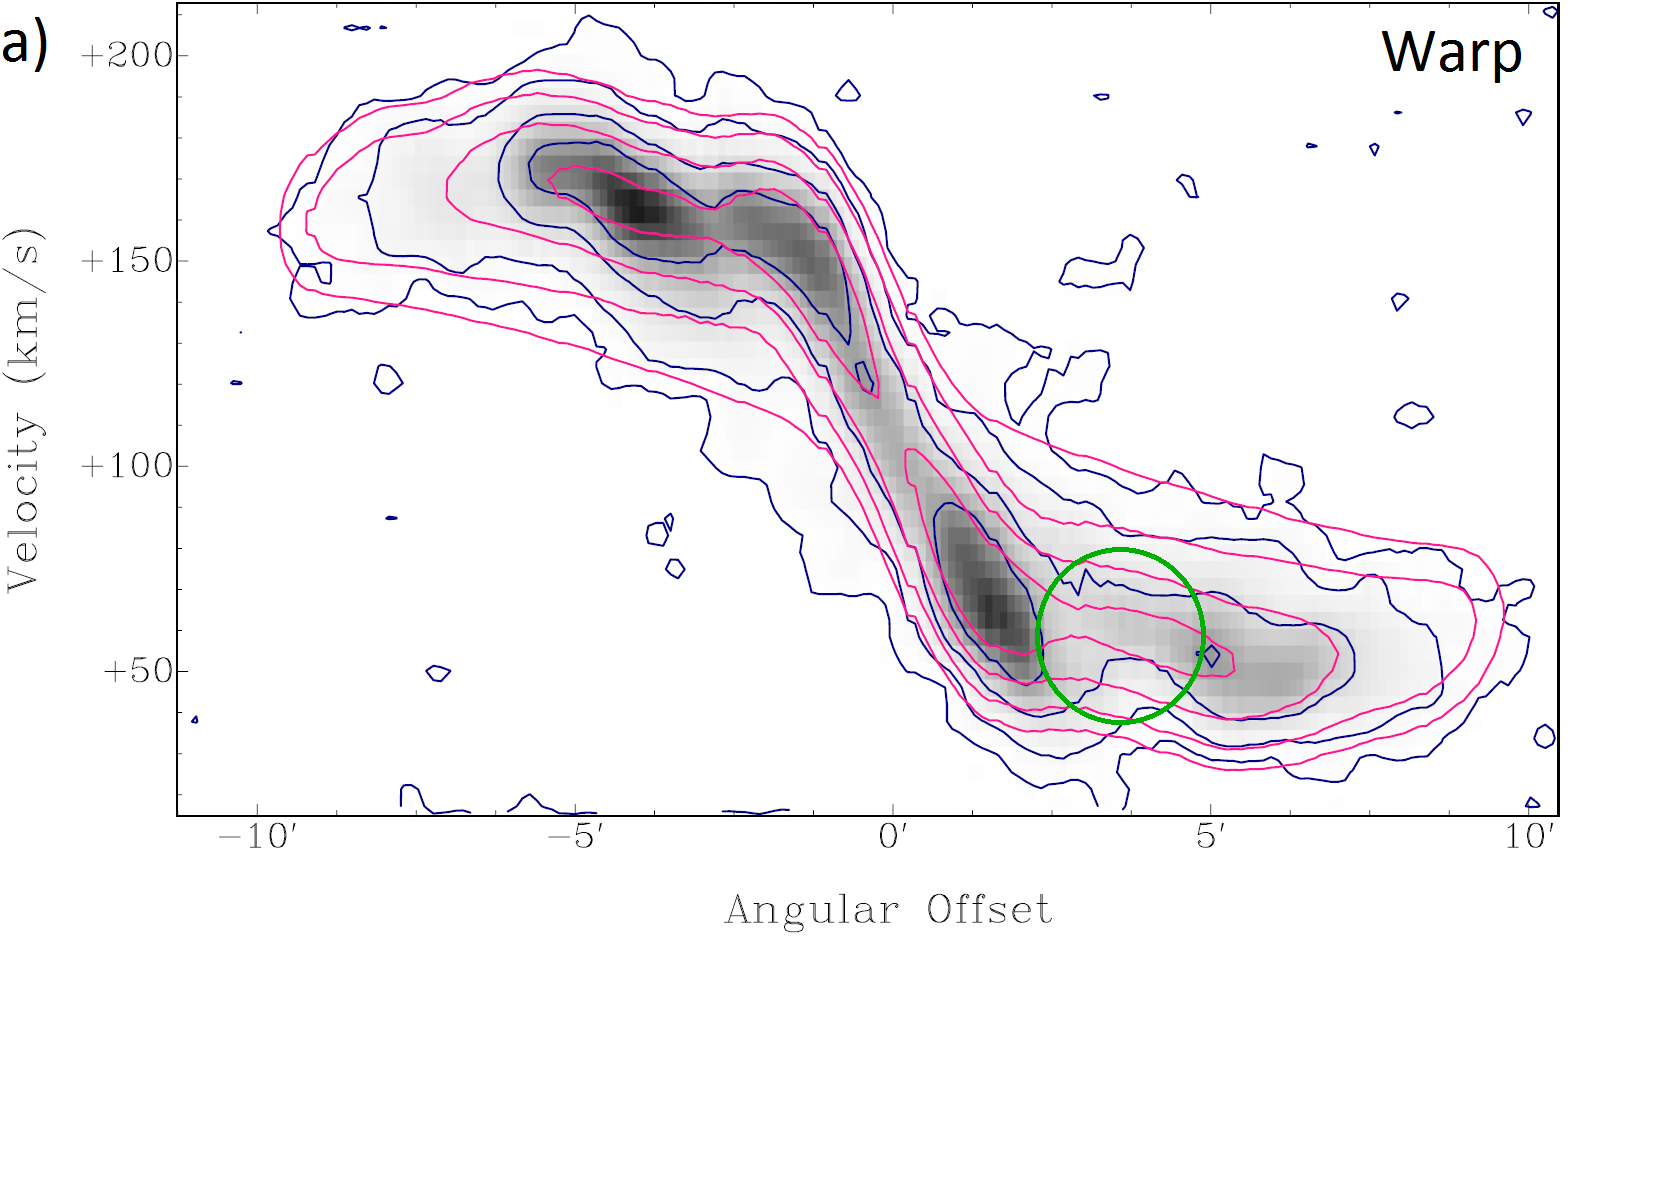
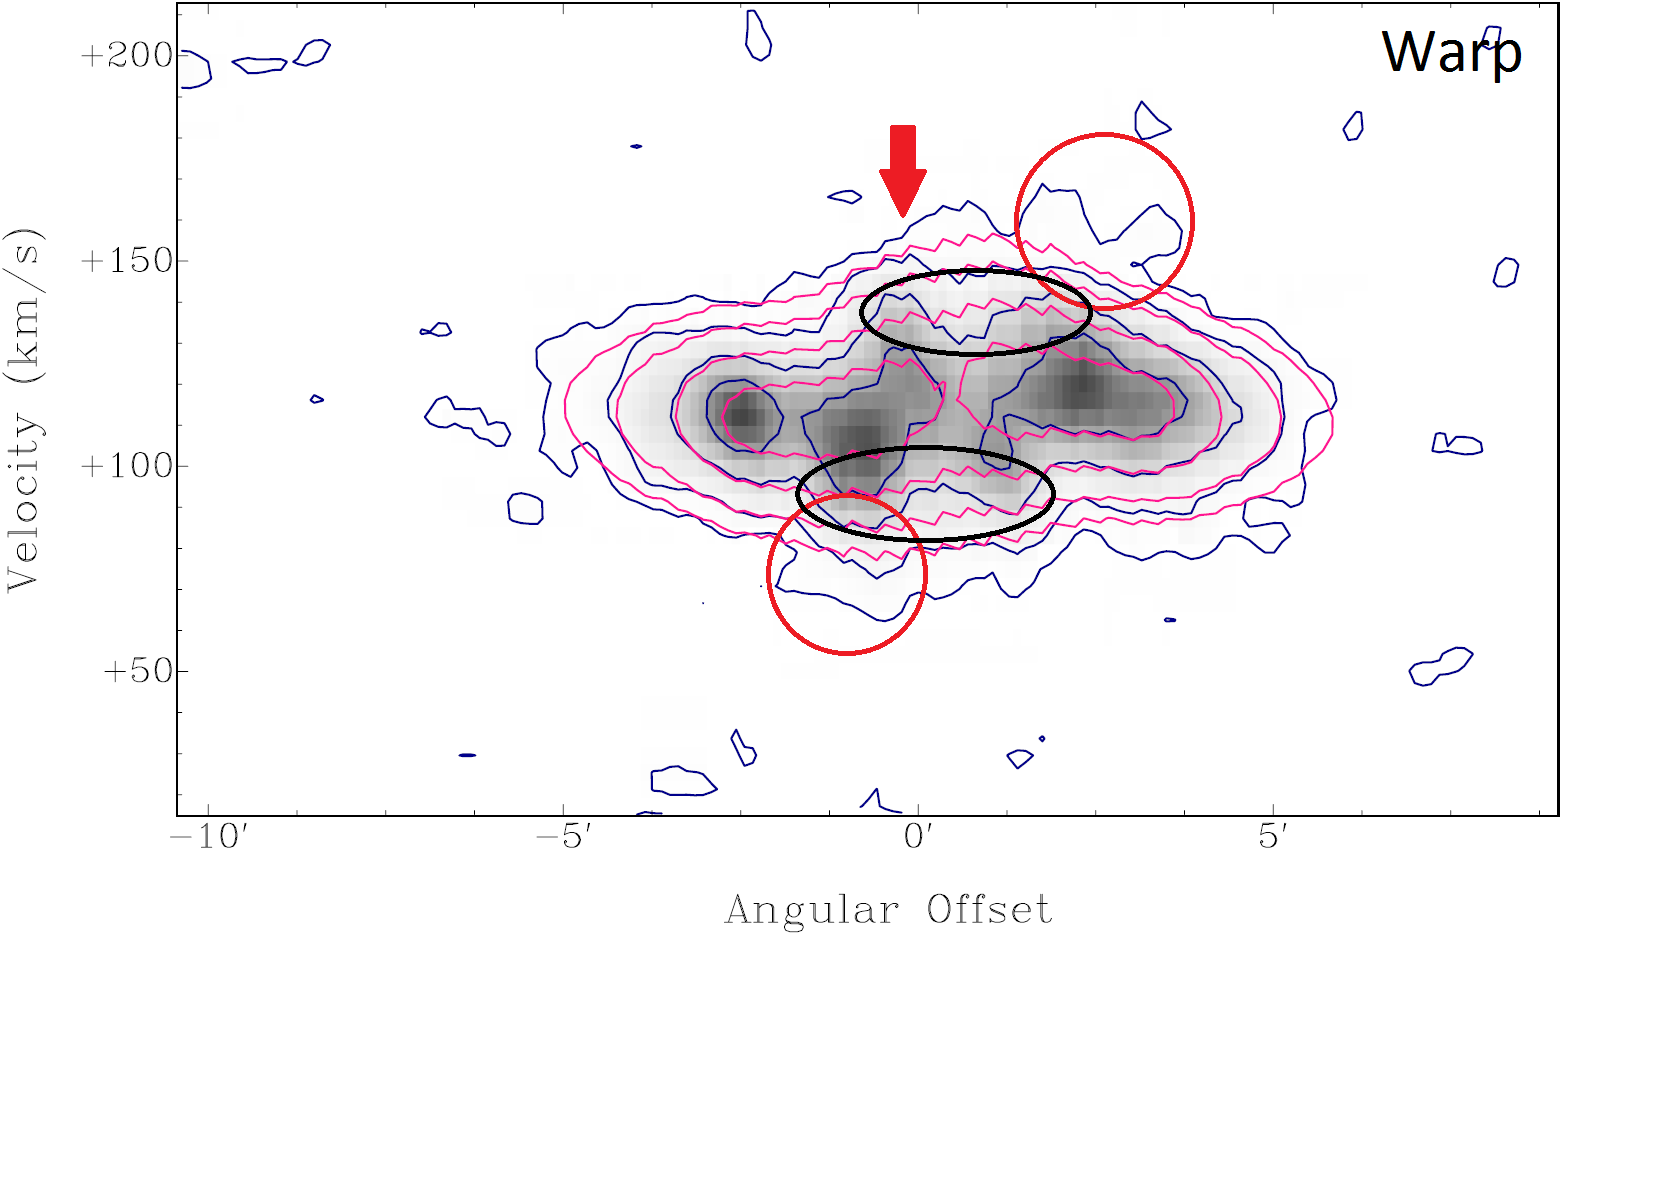
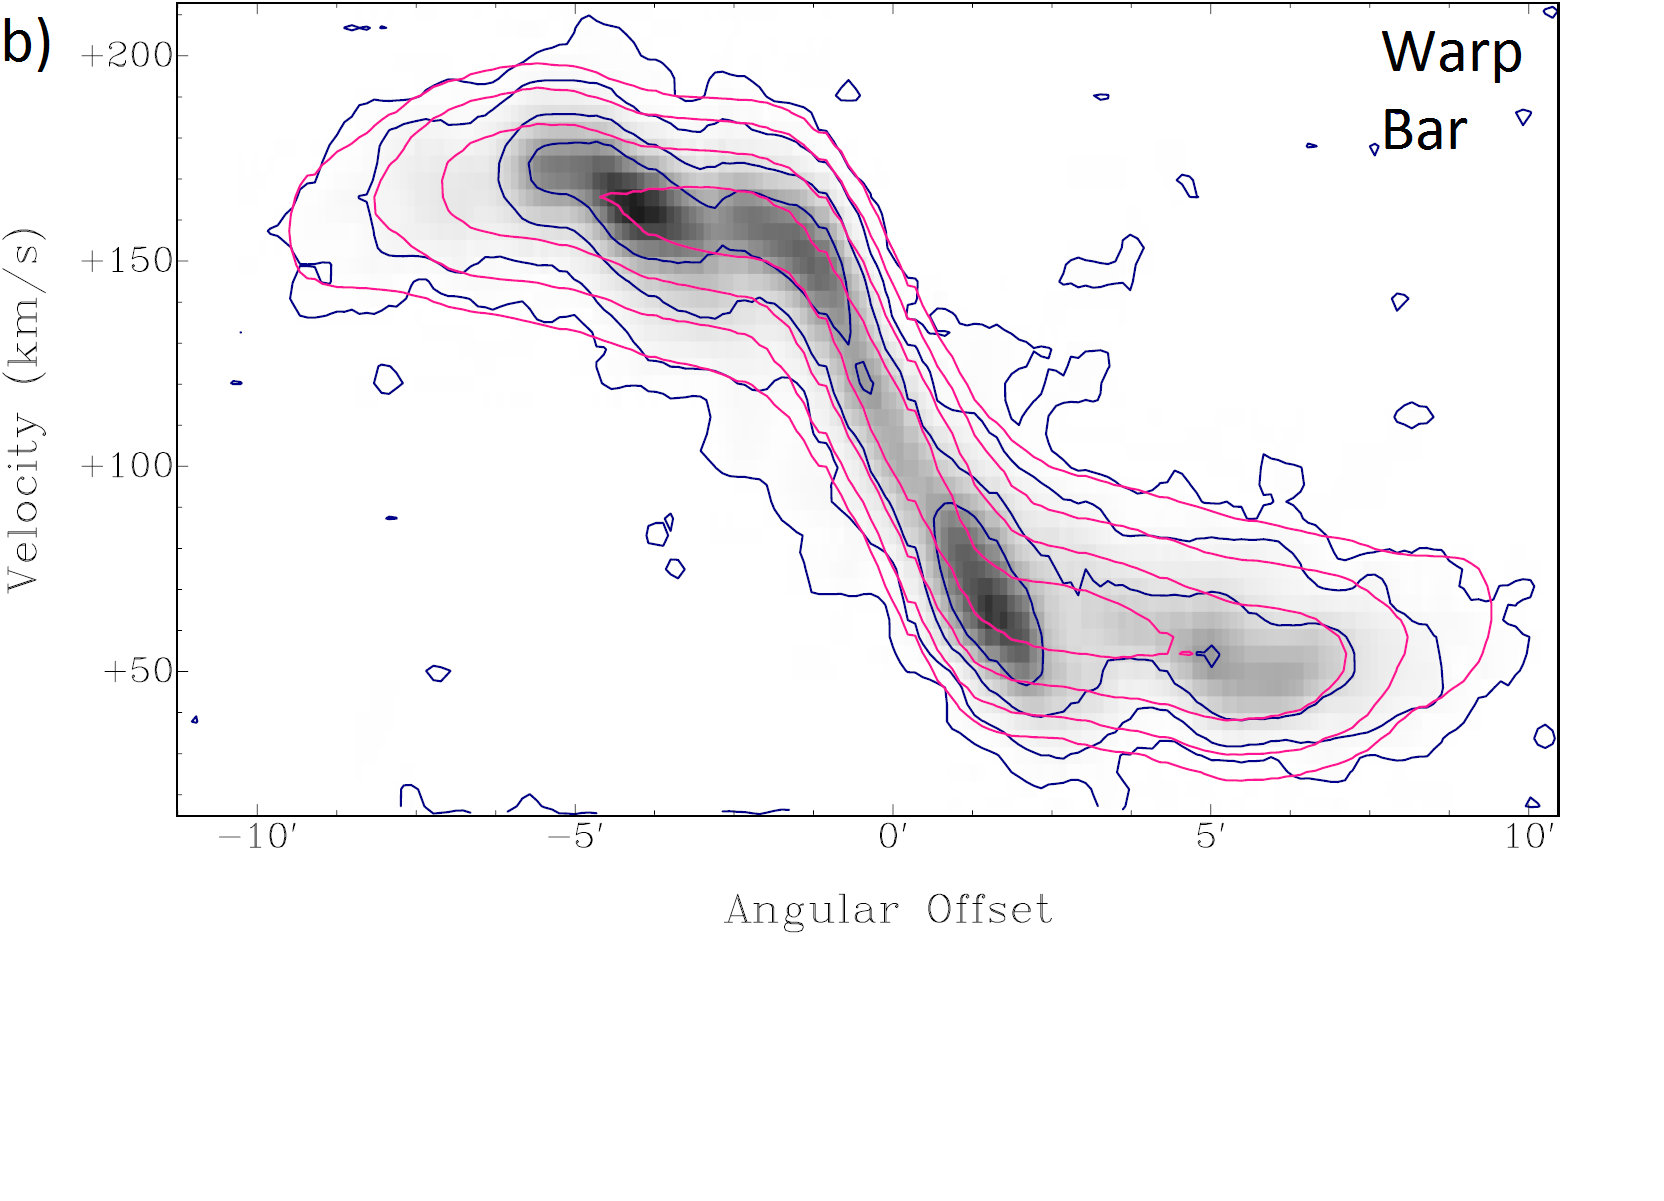
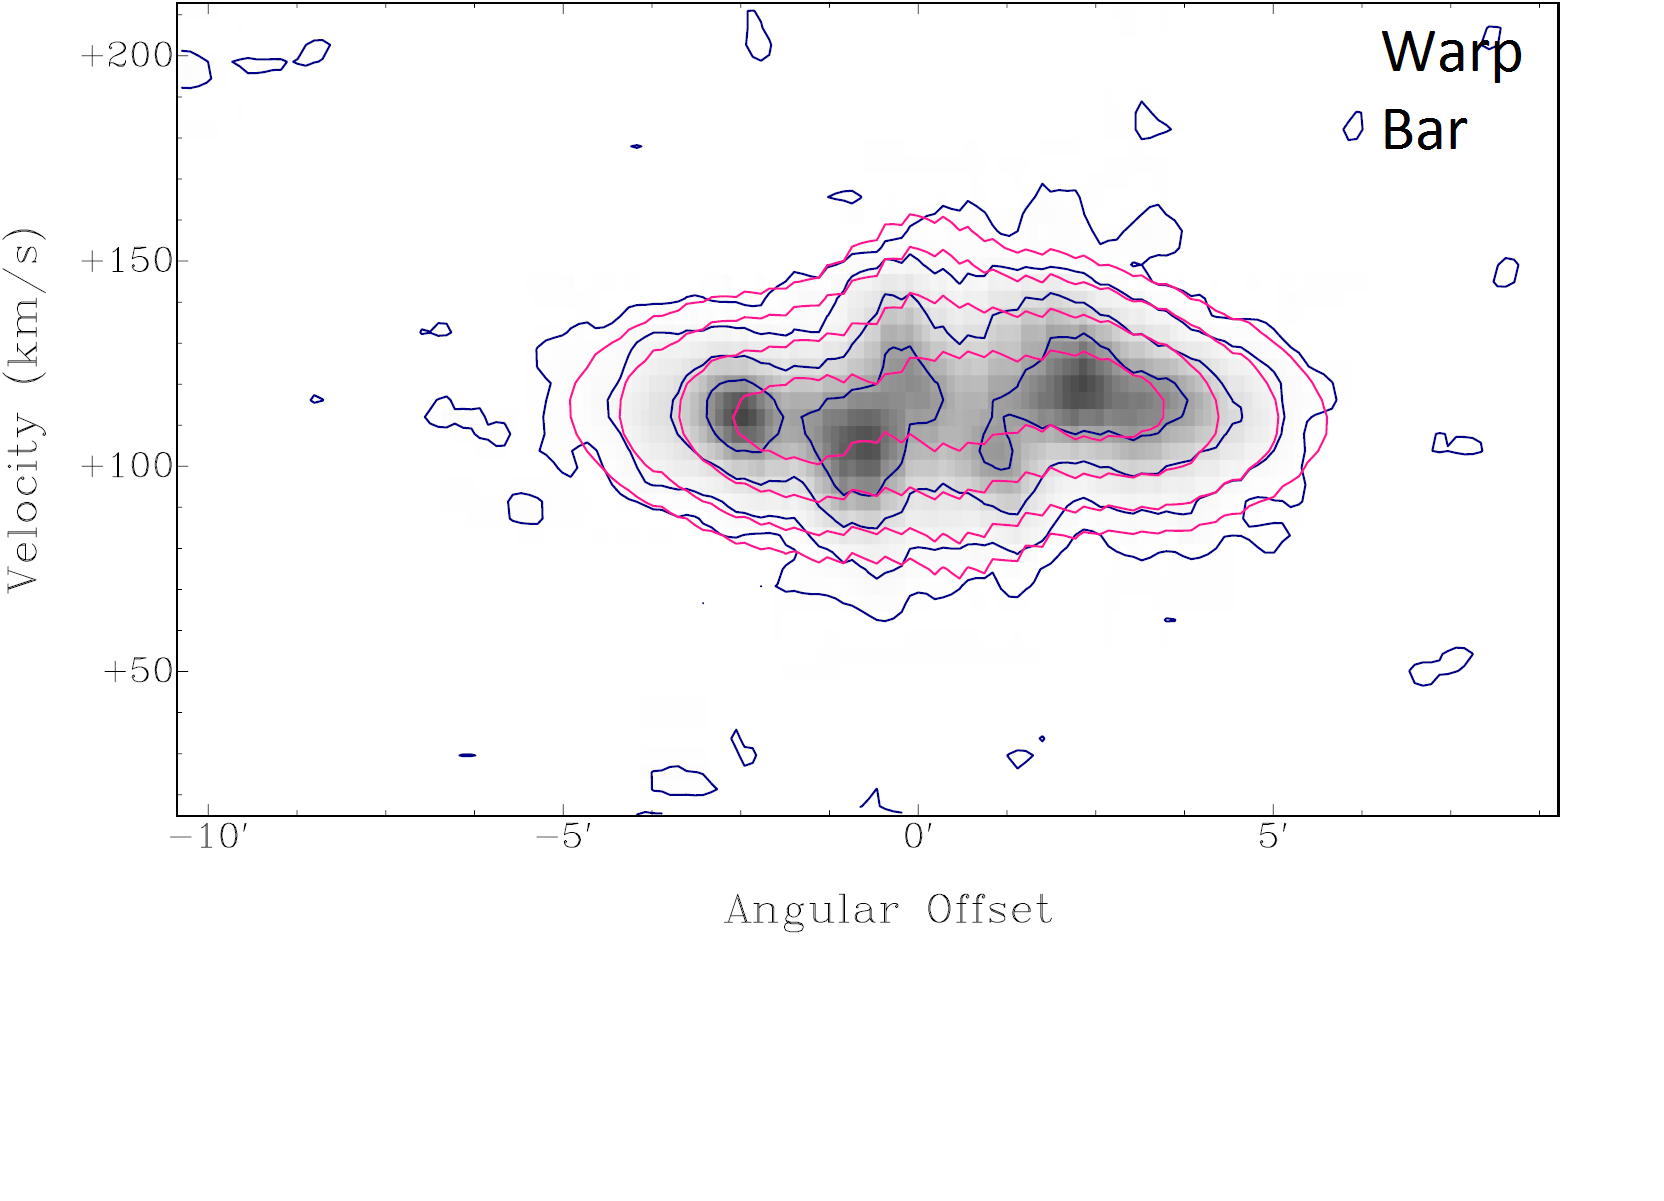
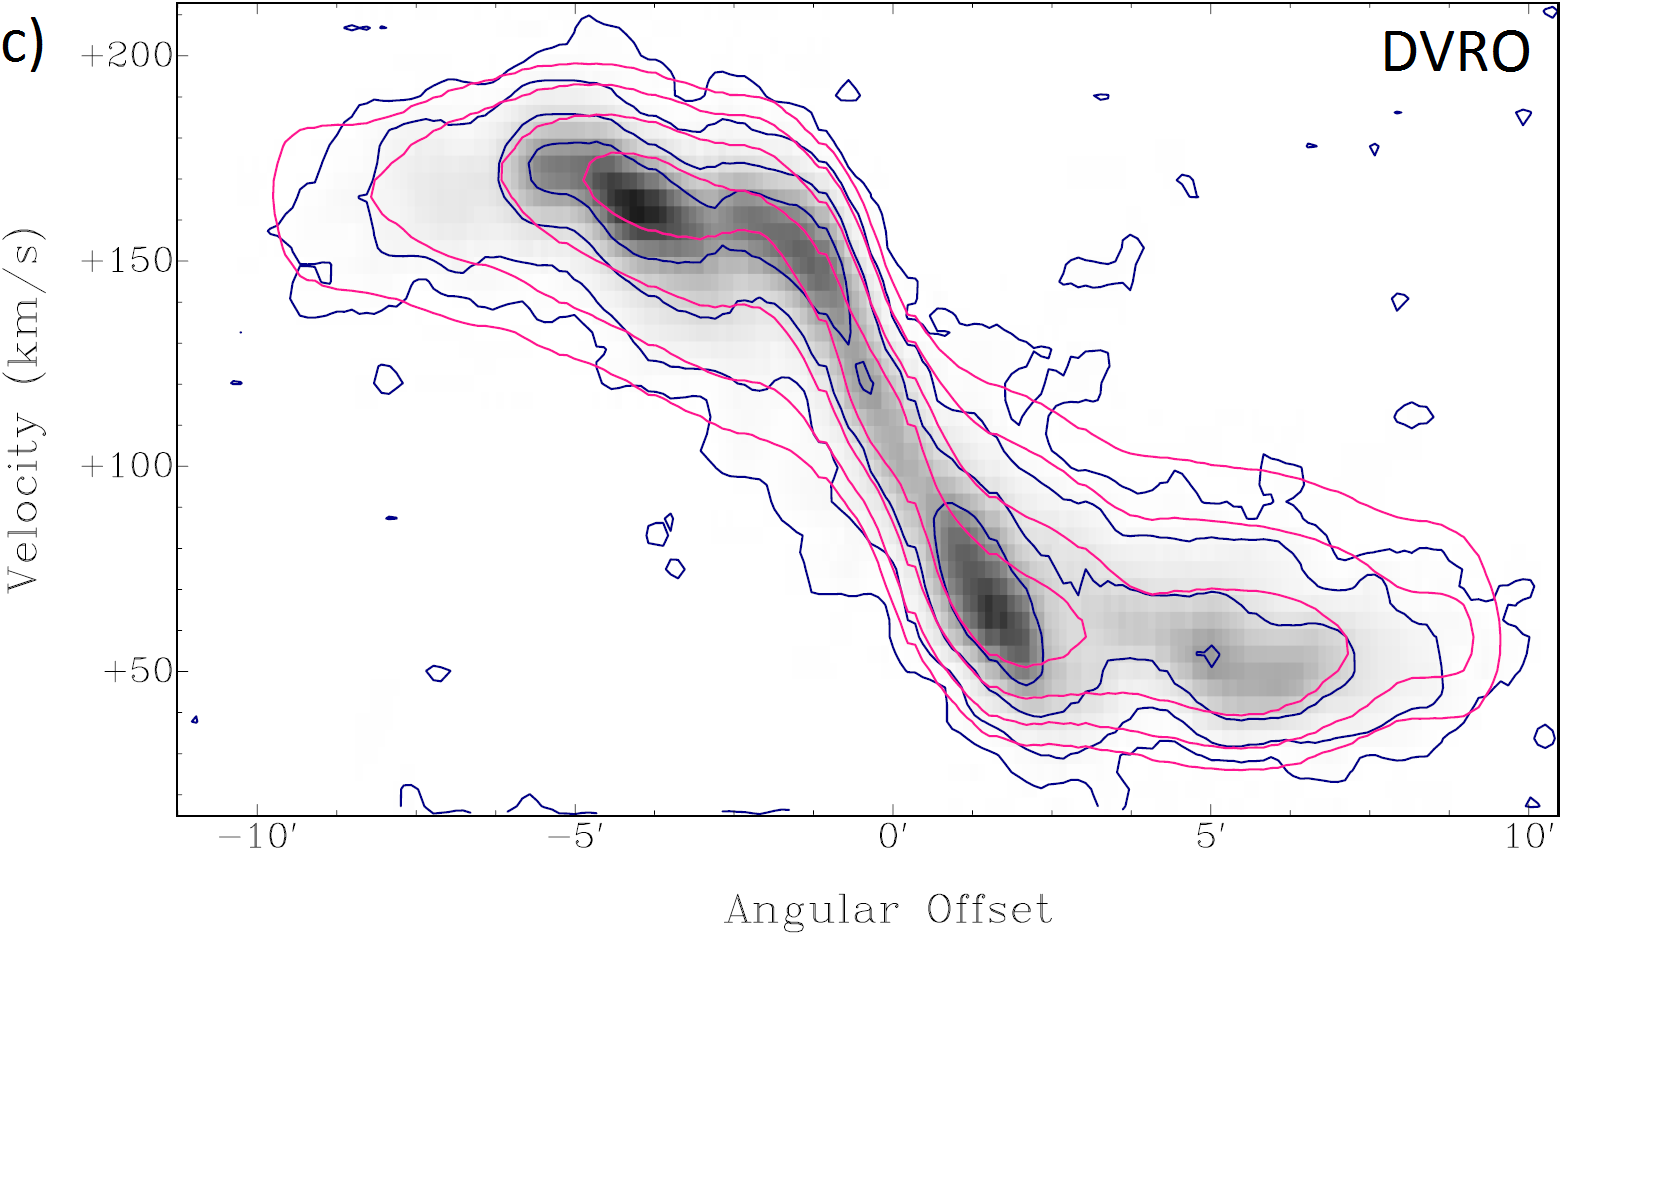
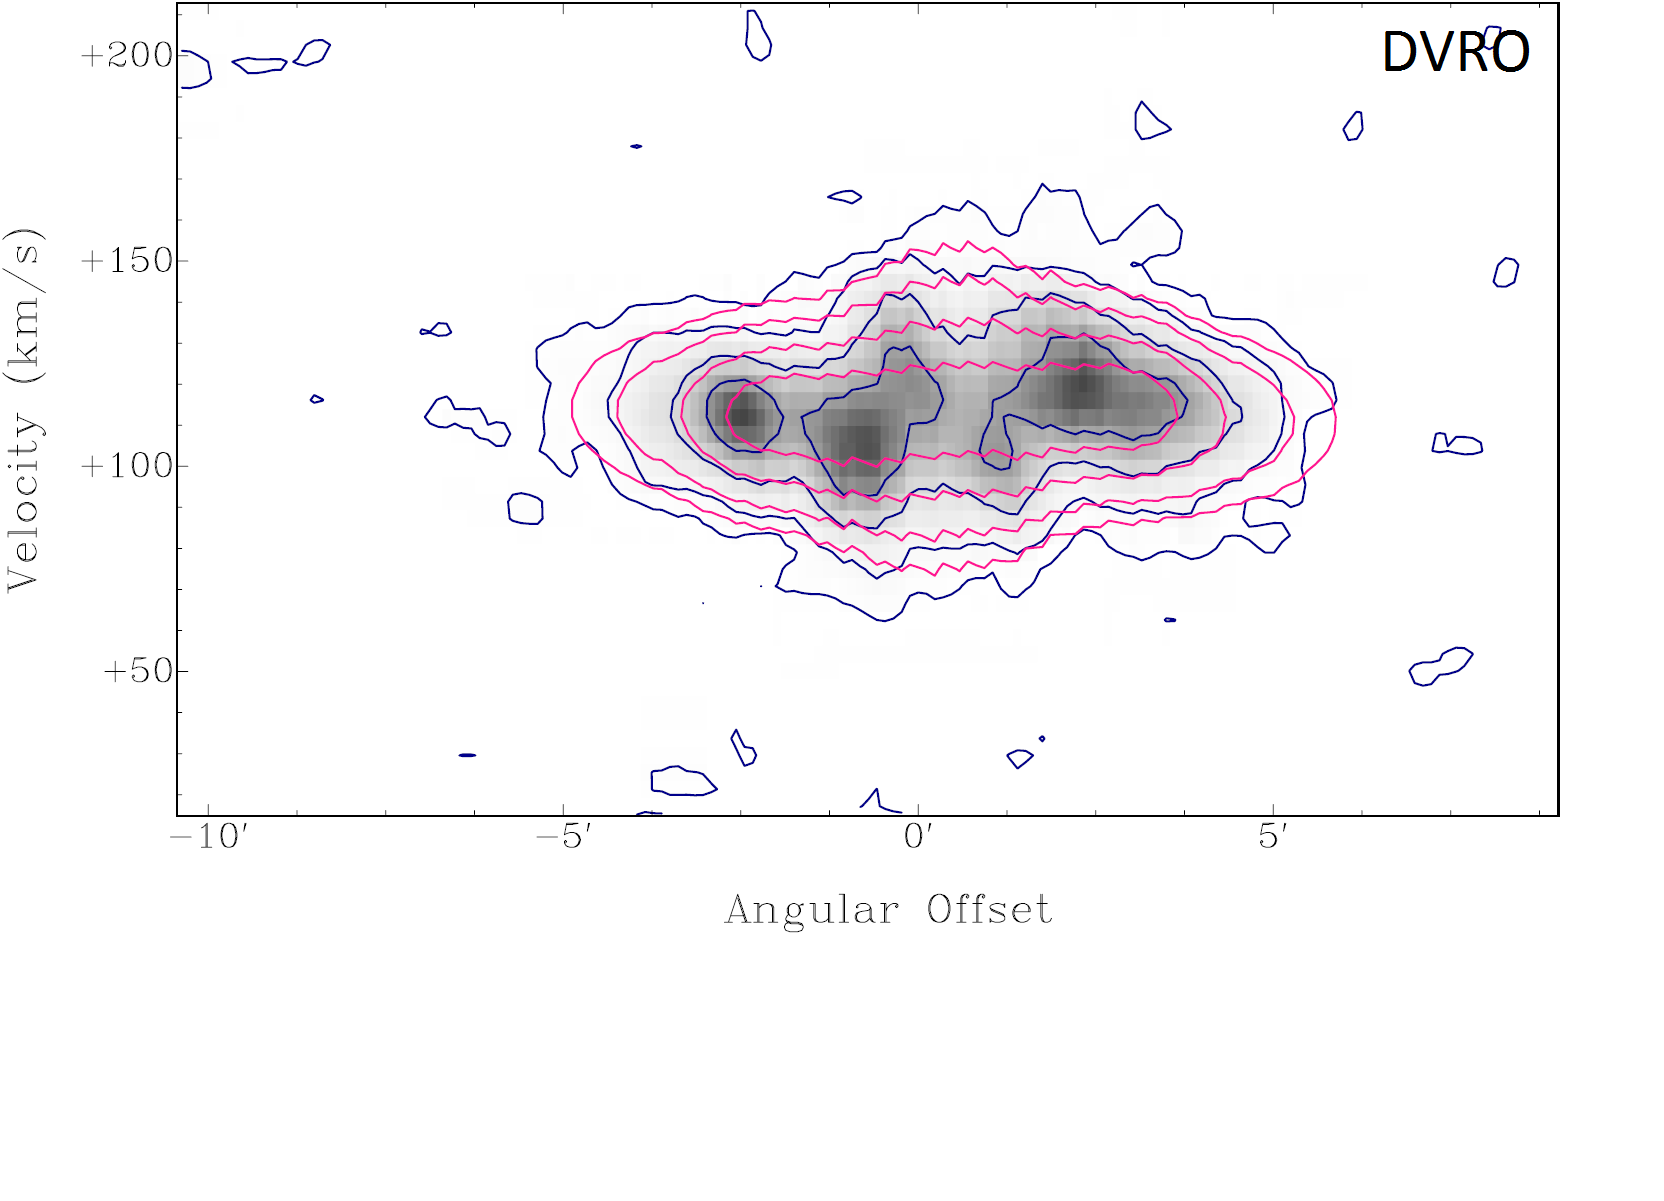
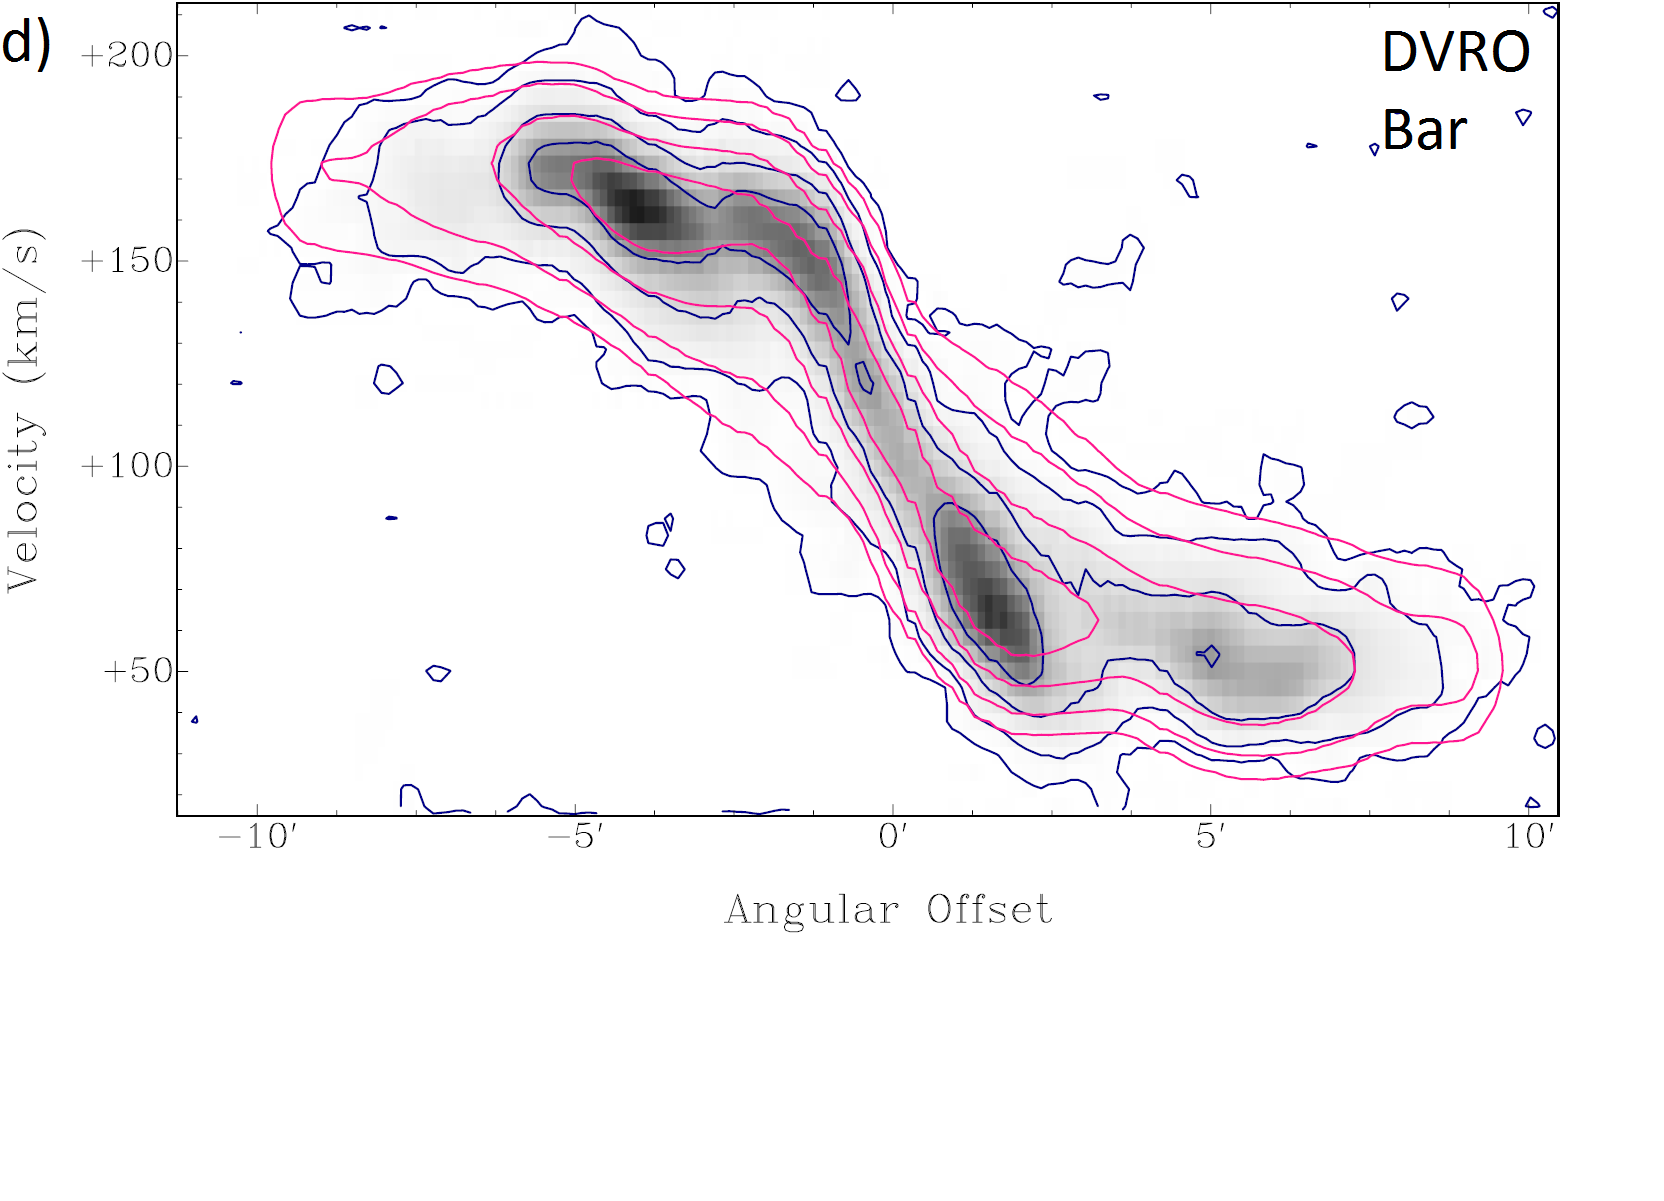
Fig. 7
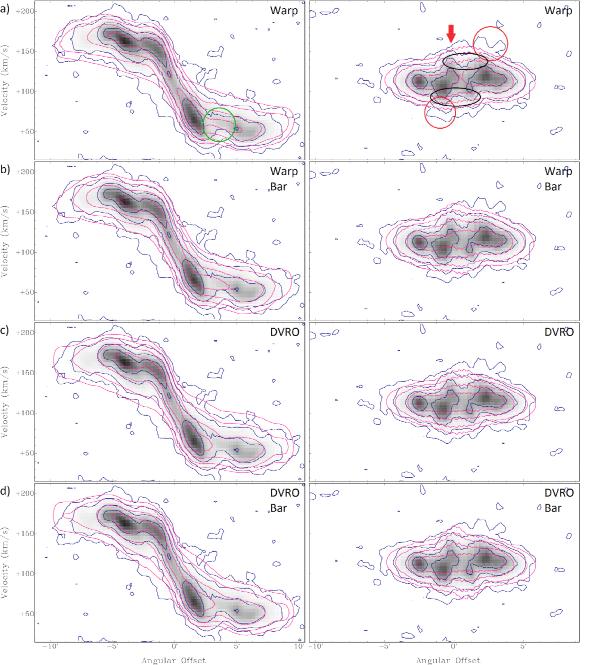
PV slices along the kinematical major (left column) and minor axis
(right column) of the 39 86 ×
3836
resolution data cube of UGCA 105 (greyscale and blue contours) in comparison with the
corresponding PV slices through different model cubes (pink contours). Contour levels
are 0.9 (2σ), 3.6, 14.4, and 40 mJy beam-1. The
characteristic features of each model are given in the top right corner of the
respective panels (DVRO: vertical gradient of rotation velocity, DVRA: vertical
gradient of radial velocity, Vrad: radial velocity, ZDRO: onset height for vertical
gradient of rotation velocity, ZDRA: onset height for vertical gradient of radial
velocity; see Sects. 5.1–5.3 for details). The arrow, circles, and ellipses in panel a)
denote unusual features in the data, some of which are successfully reproduced
by certain models, while others are not (see text for details).
86 ×
3836
resolution data cube of UGCA 105 (greyscale and blue contours) in comparison with the
corresponding PV slices through different model cubes (pink contours). Contour levels
are 0.9 (2σ), 3.6, 14.4, and 40 mJy beam-1. The
characteristic features of each model are given in the top right corner of the
respective panels (DVRO: vertical gradient of rotation velocity, DVRA: vertical
gradient of radial velocity, Vrad: radial velocity, ZDRO: onset height for vertical
gradient of rotation velocity, ZDRA: onset height for vertical gradient of radial
velocity; see Sects. 5.1–5.3 for details). The arrow, circles, and ellipses in panel a)
denote unusual features in the data, some of which are successfully reproduced
by certain models, while others are not (see text for details).

Current usage metrics show cumulative count of Article Views (full-text article views including HTML views, PDF and ePub downloads, according to the available data) and Abstracts Views on Vision4Press platform.
Data correspond to usage on the plateform after 2015. The current usage metrics is available 48-96 hours after online publication and is updated daily on week days.
Initial download of the metrics may take a while.