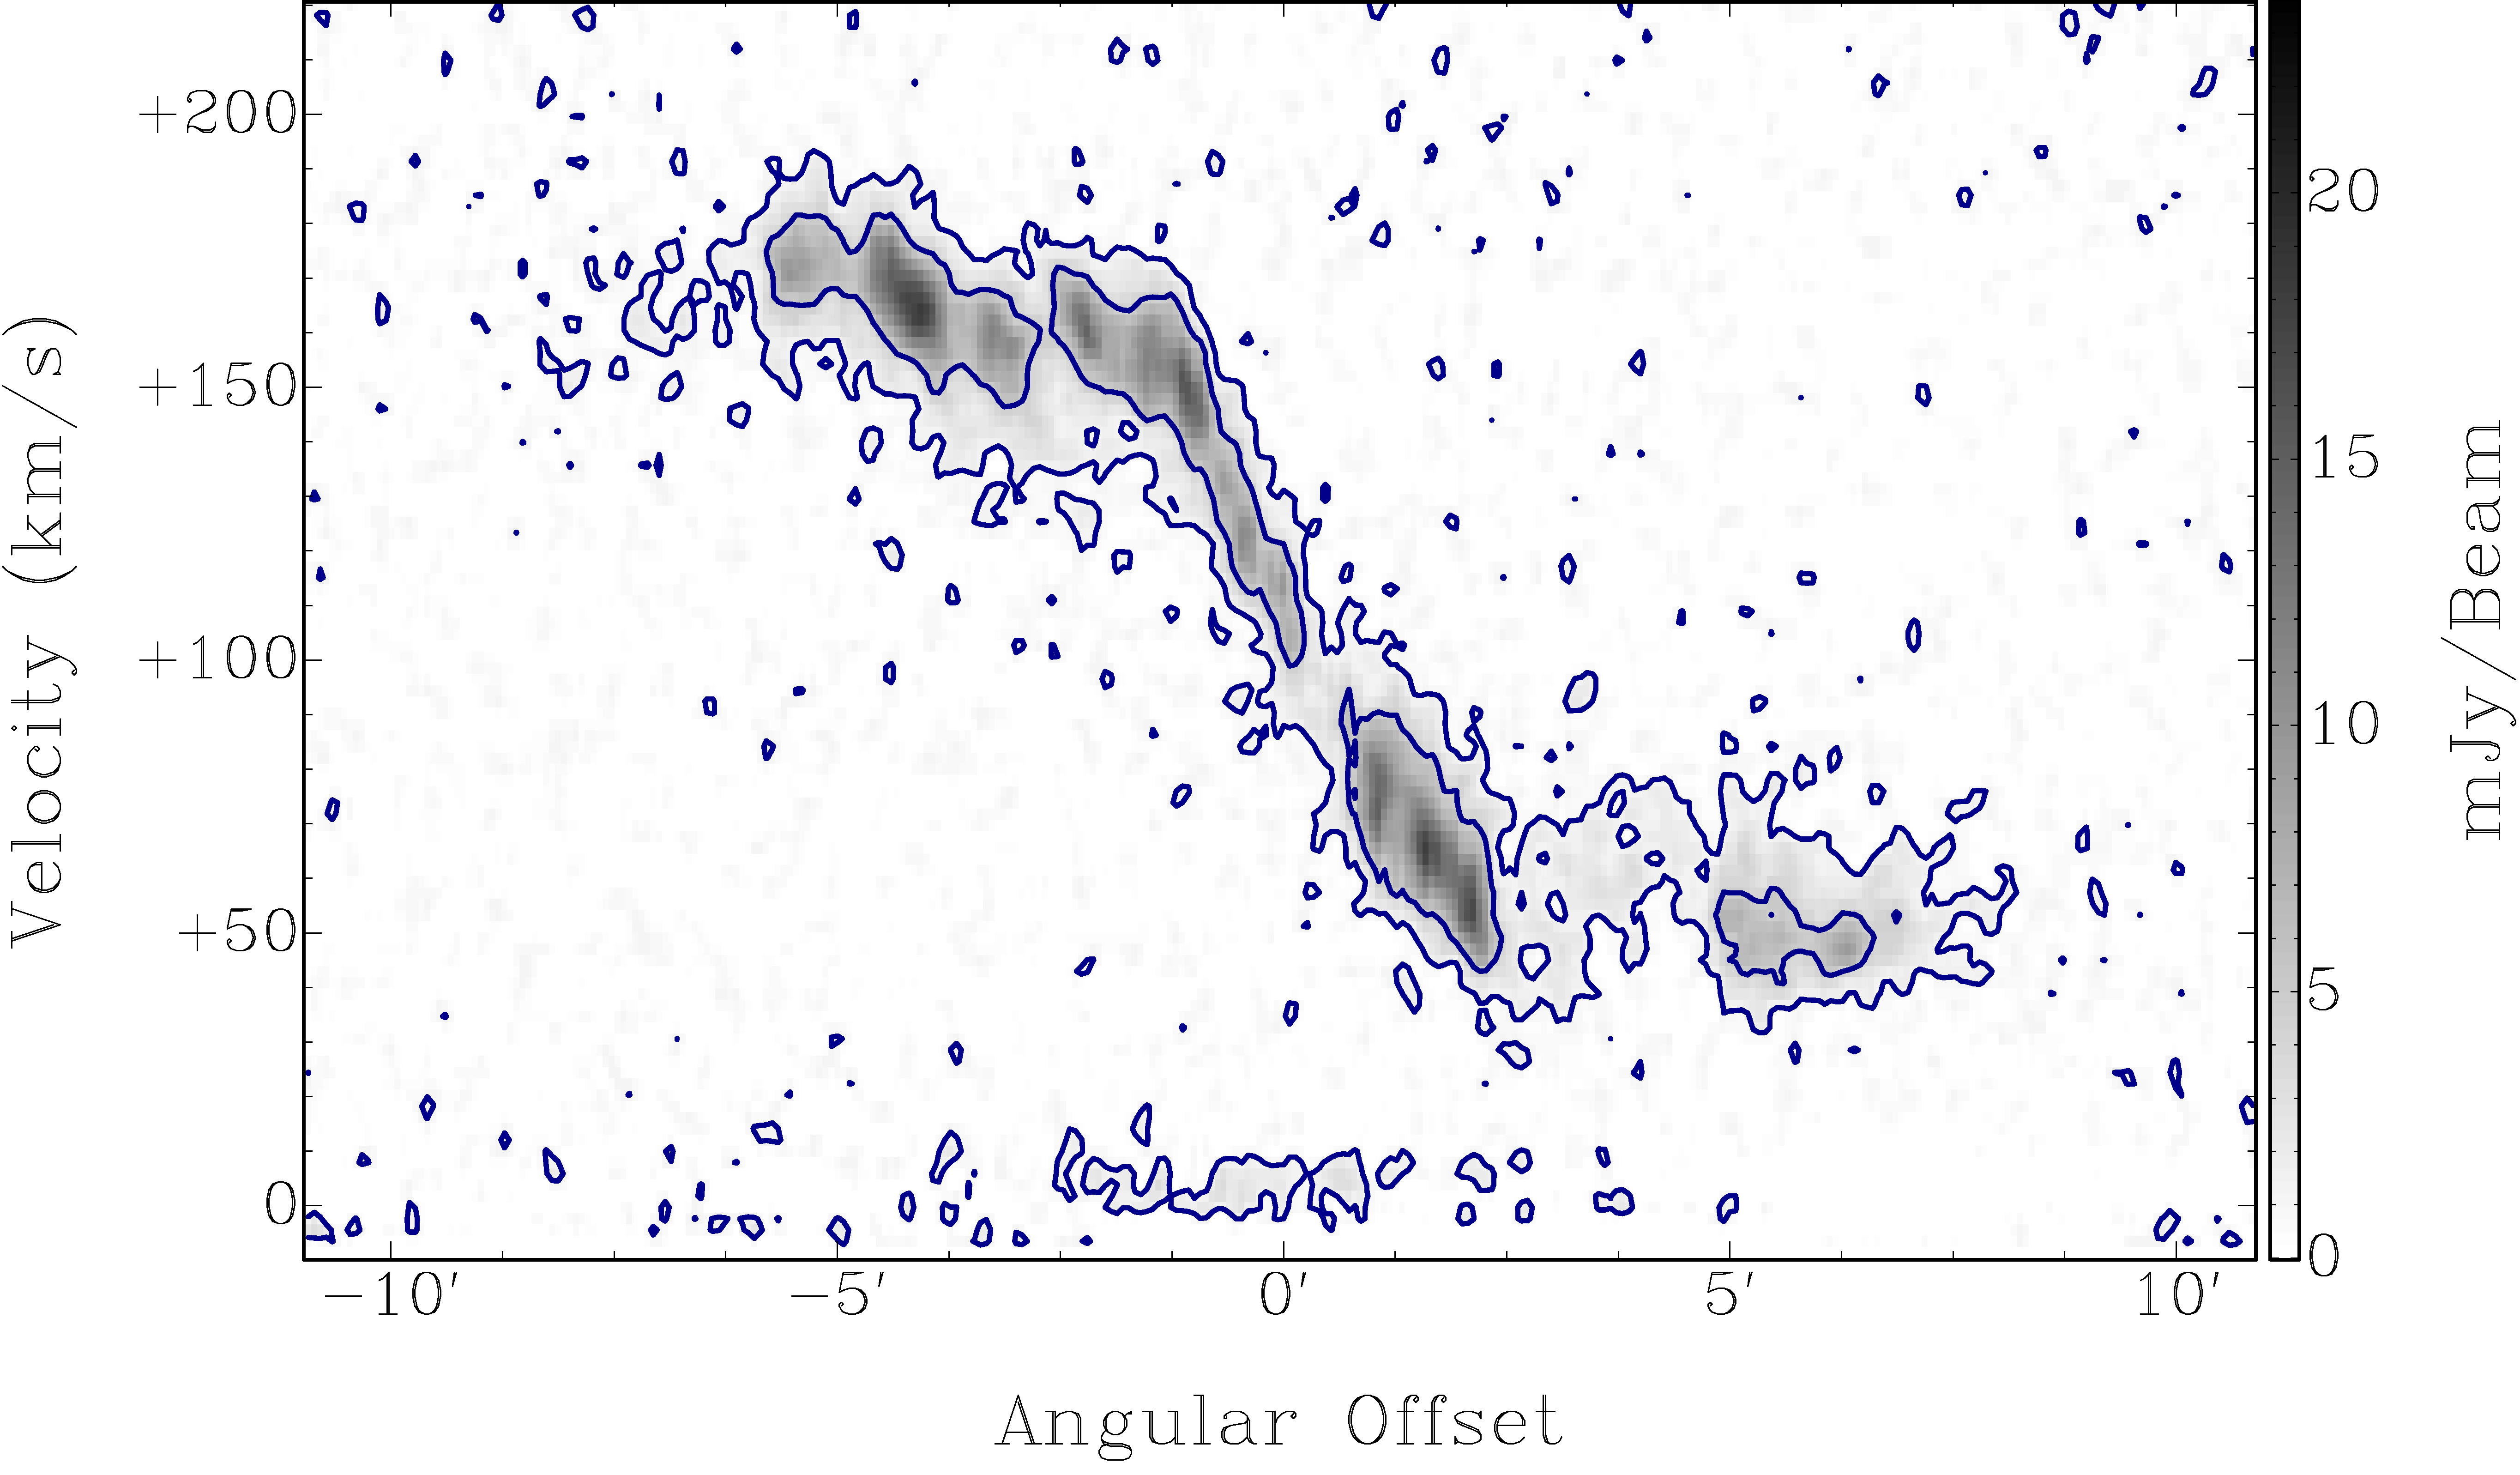
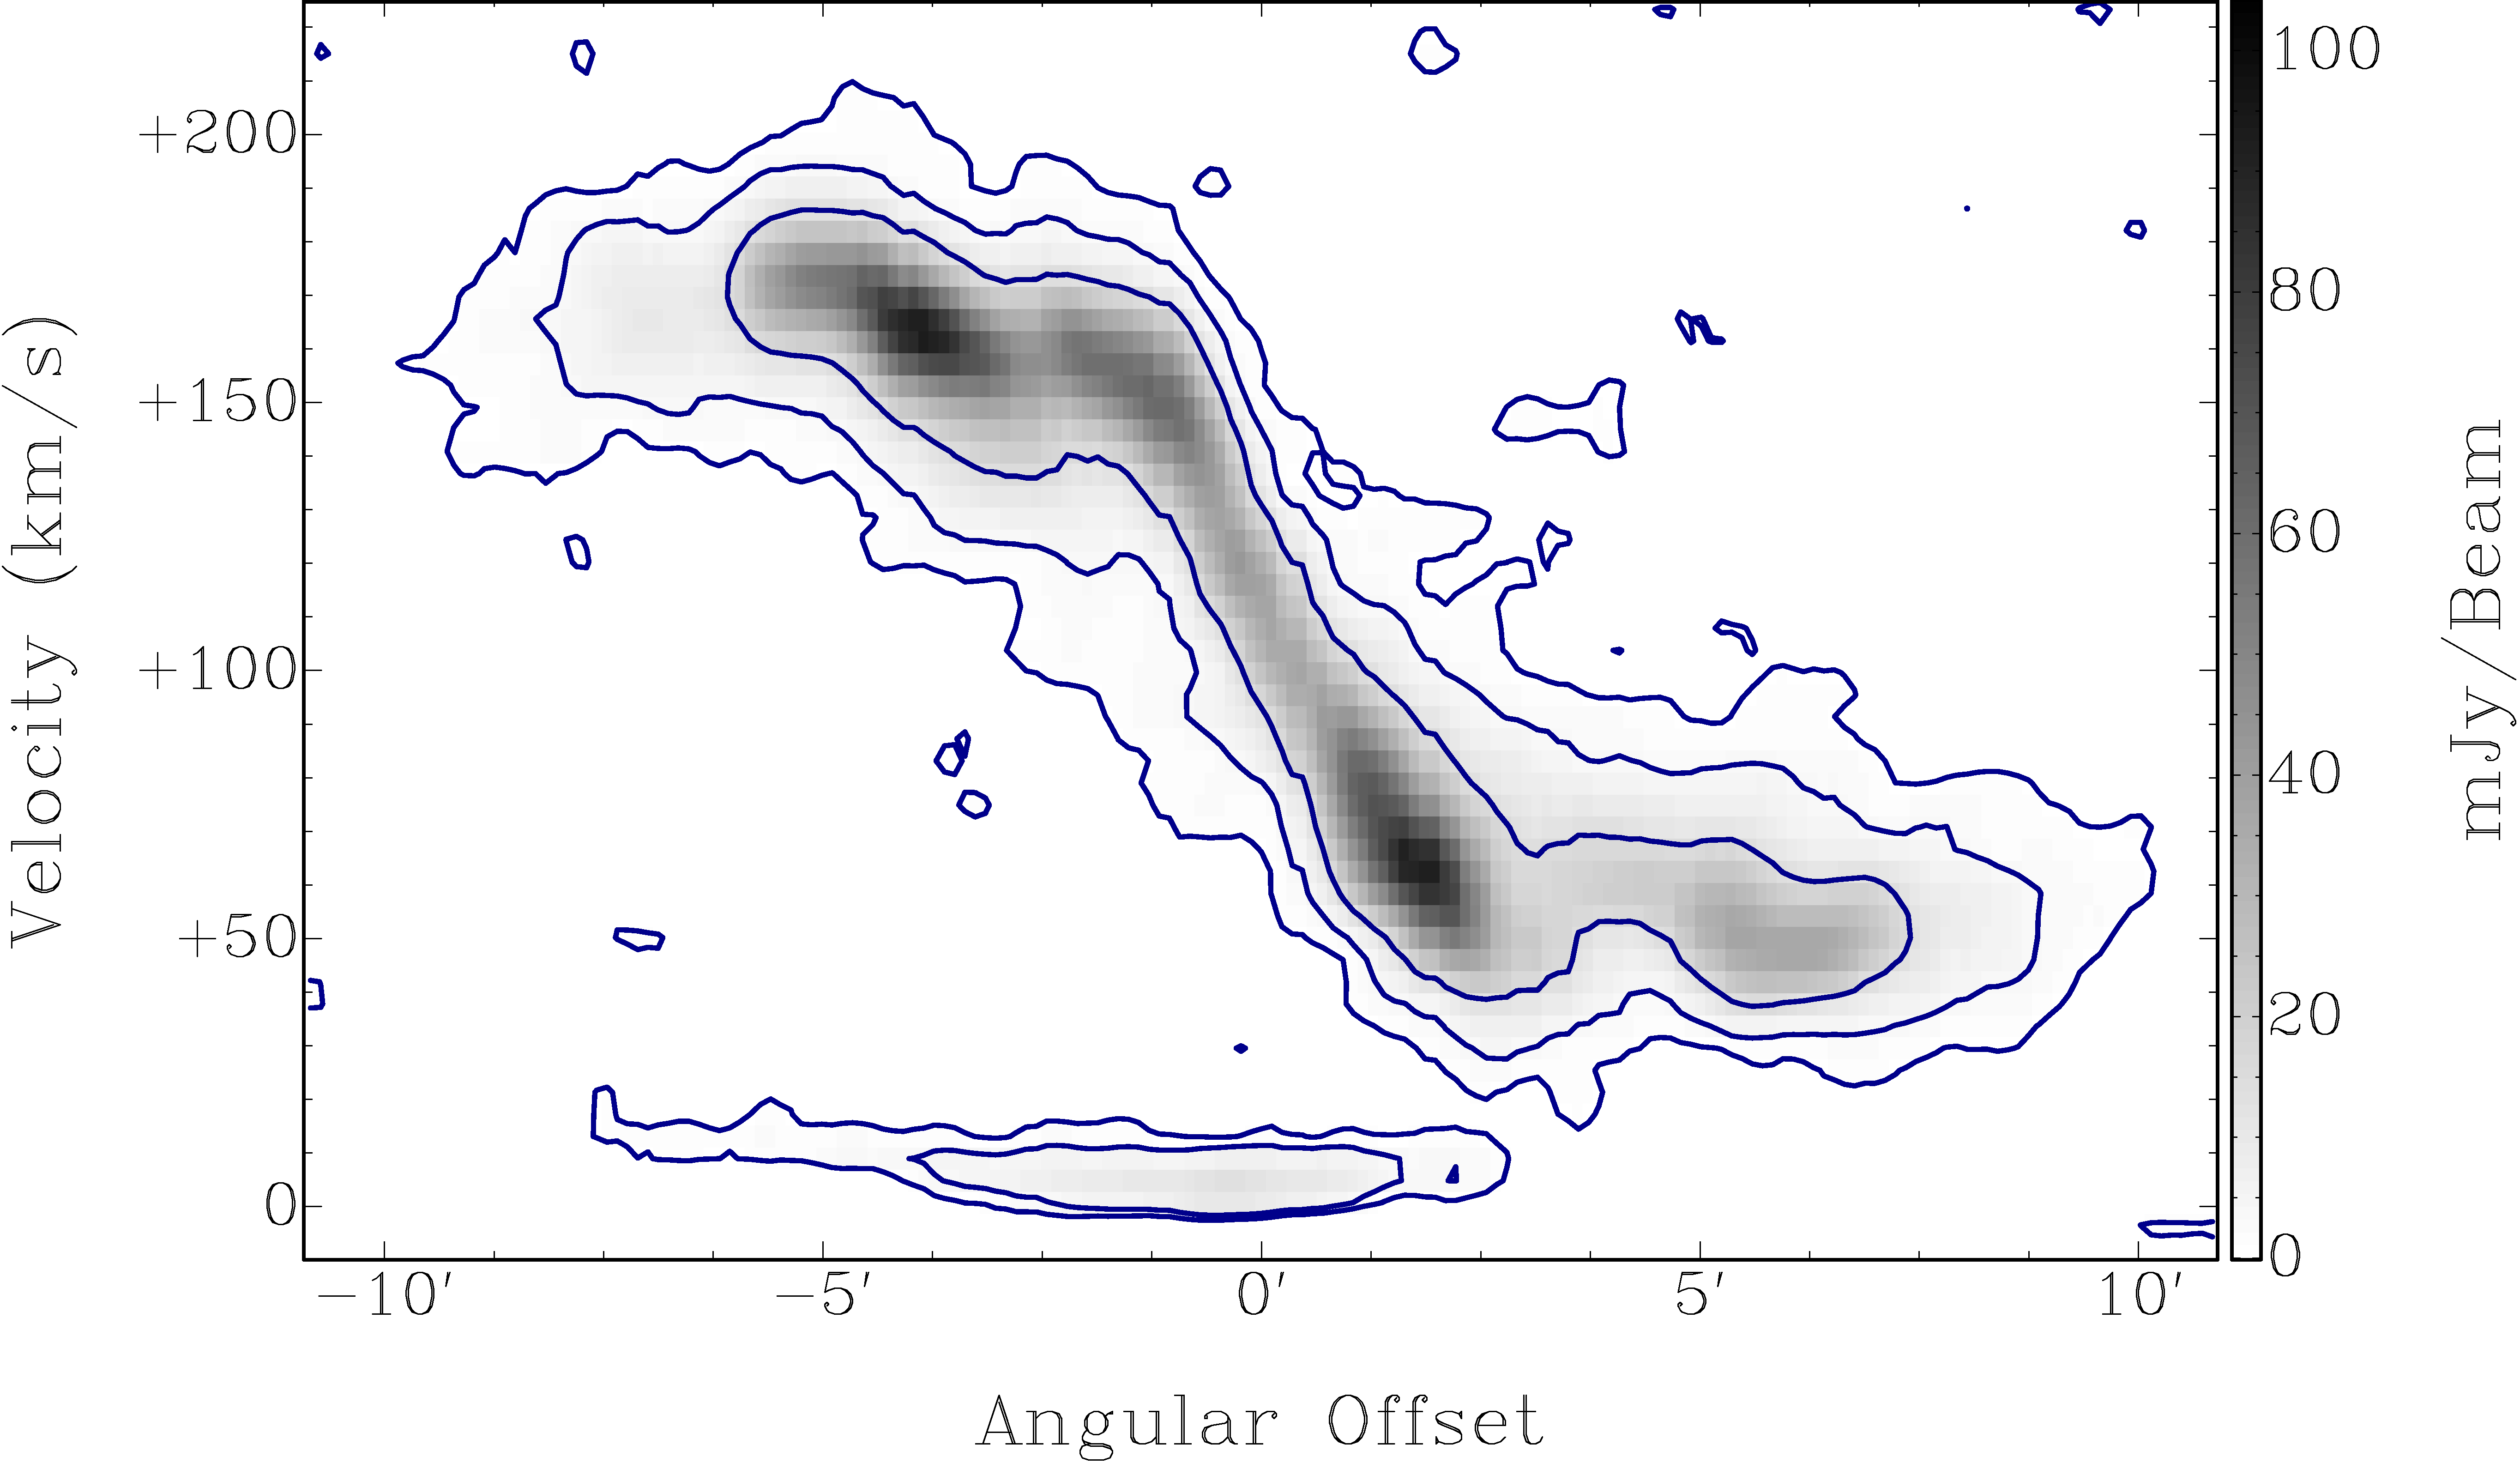
Fig. 6
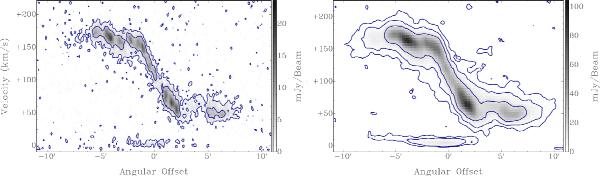
Left: position-velocity (PV) diagram along the kinematical major
axis of the 14 84 ×
1314
resolution cube of UGCA 105, with contour levels of 1.2 (2σ) and
4.8 mJy beam-1. Right: position-velocity (PV) diagram
along the kinematical major axis of the 3986 ×
3836
resolution cube of UGCA 105, with contour levels of 0.9 (2σ), 3.6,
and 14.4 mJy beam-1. The low-resolution data shows a “beard” of material at
anomalous velocities, indicating the presence of a lagging extraplanar gaseous
component. The feature visible at velocities near zero in both panels is Galactic
H i emission.
84 ×
1314
resolution cube of UGCA 105, with contour levels of 1.2 (2σ) and
4.8 mJy beam-1. Right: position-velocity (PV) diagram
along the kinematical major axis of the 3986 ×
3836
resolution cube of UGCA 105, with contour levels of 0.9 (2σ), 3.6,
and 14.4 mJy beam-1. The low-resolution data shows a “beard” of material at
anomalous velocities, indicating the presence of a lagging extraplanar gaseous
component. The feature visible at velocities near zero in both panels is Galactic
H i emission.
Current usage metrics show cumulative count of Article Views (full-text article views including HTML views, PDF and ePub downloads, according to the available data) and Abstracts Views on Vision4Press platform.
Data correspond to usage on the plateform after 2015. The current usage metrics is available 48-96 hours after online publication and is updated daily on week days.
Initial download of the metrics may take a while.