Fig. 5
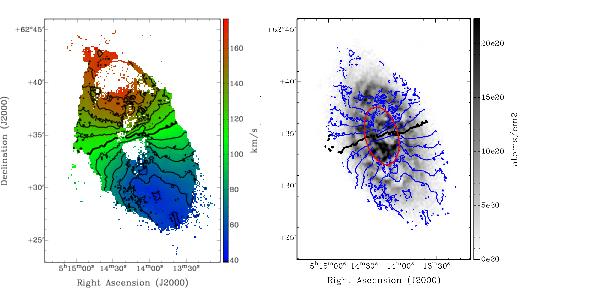
Left: bulk-motion velocity field of UGCA 105, derived from the low-resolution data cube, with contour levels ranging from 50 to 170 km s-1, in steps of 10 km s-1. The thick line represents the systemic velocity of 111 km s-1. Right: full-resolution H i column density map, overlaid with velocity contours as shown in the left-hand panel. The red ellipse shows the extent of the optical disk (r25).
Current usage metrics show cumulative count of Article Views (full-text article views including HTML views, PDF and ePub downloads, according to the available data) and Abstracts Views on Vision4Press platform.
Data correspond to usage on the plateform after 2015. The current usage metrics is available 48-96 hours after online publication and is updated daily on week days.
Initial download of the metrics may take a while.