Fig. 4
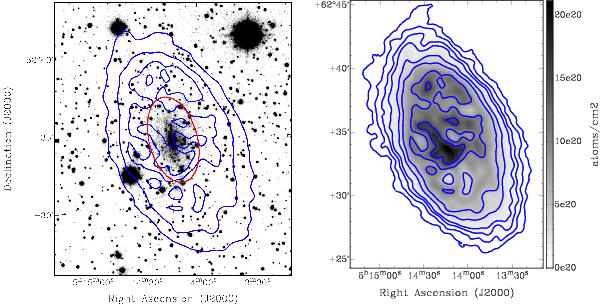
Left: DSS I-band image of UGCA 105, overlaid with
contours of the 39 86 ×
3836
resolution column density map at 1.5, 5, 10, and 15 × 1020
atoms cm-2. The red ellipse represents the extent of the optical disk
(r25). Right: H i column
density map at the same resolution. Contour levels are 0.15, 0.5, 1, 1.5, 3, 5, 10,
and 15 × 1020 atoms cm-2.
86 ×
3836
resolution column density map at 1.5, 5, 10, and 15 × 1020
atoms cm-2. The red ellipse represents the extent of the optical disk
(r25). Right: H i column
density map at the same resolution. Contour levels are 0.15, 0.5, 1, 1.5, 3, 5, 10,
and 15 × 1020 atoms cm-2.
Current usage metrics show cumulative count of Article Views (full-text article views including HTML views, PDF and ePub downloads, according to the available data) and Abstracts Views on Vision4Press platform.
Data correspond to usage on the plateform after 2015. The current usage metrics is available 48-96 hours after online publication and is updated daily on week days.
Initial download of the metrics may take a while.