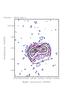
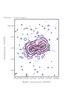
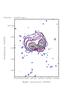
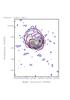
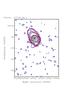
Fig. 9
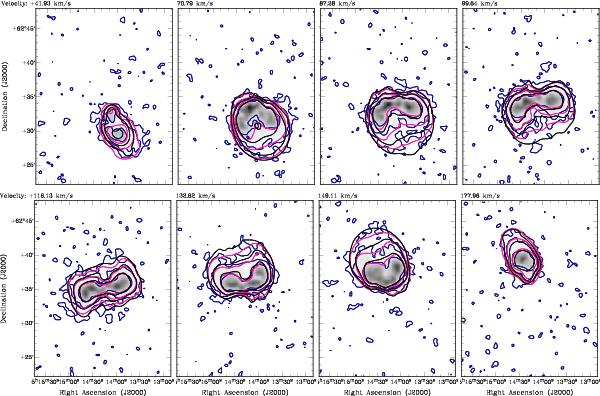
Selected channel maps from the 39 86 ×
3836
resolution data cube of UGCA 105 (greyscale and blue contours) in comparison with
the corresponding channel maps of the TiRiFiC model including
both vertical velocity gradients DVRO, DVRA but no onset heights ZDRO, ZDRA (as
shown in panel g) of Fig. 7; black contours)
and of our best-fit TiRiFiC model (as shown in Fig. 11 and panel h) of Fig. 7; pink contours). Contour levels are 0.9 (2σ),
3.6, and 14.4 mJy beam-1. The heliocentric velocity is noted at the upper
left corner of each map.
86 ×
3836
resolution data cube of UGCA 105 (greyscale and blue contours) in comparison with
the corresponding channel maps of the TiRiFiC model including
both vertical velocity gradients DVRO, DVRA but no onset heights ZDRO, ZDRA (as
shown in panel g) of Fig. 7; black contours)
and of our best-fit TiRiFiC model (as shown in Fig. 11 and panel h) of Fig. 7; pink contours). Contour levels are 0.9 (2σ),
3.6, and 14.4 mJy beam-1. The heliocentric velocity is noted at the upper
left corner of each map.
Current usage metrics show cumulative count of Article Views (full-text article views including HTML views, PDF and ePub downloads, according to the available data) and Abstracts Views on Vision4Press platform.
Data correspond to usage on the plateform after 2015. The current usage metrics is available 48-96 hours after online publication and is updated daily on week days.
Initial download of the metrics may take a while.