Free Access
Fig. 8
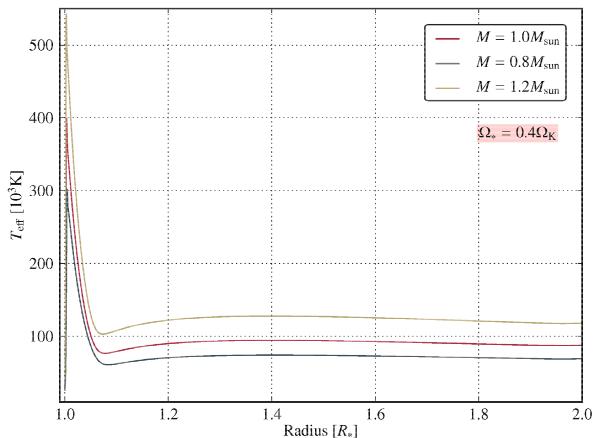
Analogous to Fig. 7, we compare the effective temperatures of the three different stellar masses (1.0,0.8, and 1.2 M⊙) in this plot. Again, Ω = 0.4ΩK has been chosen as an example of the stellar rotation rate. We note that the effective temperature rises with increasing stellar mass.
Current usage metrics show cumulative count of Article Views (full-text article views including HTML views, PDF and ePub downloads, according to the available data) and Abstracts Views on Vision4Press platform.
Data correspond to usage on the plateform after 2015. The current usage metrics is available 48-96 hours after online publication and is updated daily on week days.
Initial download of the metrics may take a while.