Fig. 2
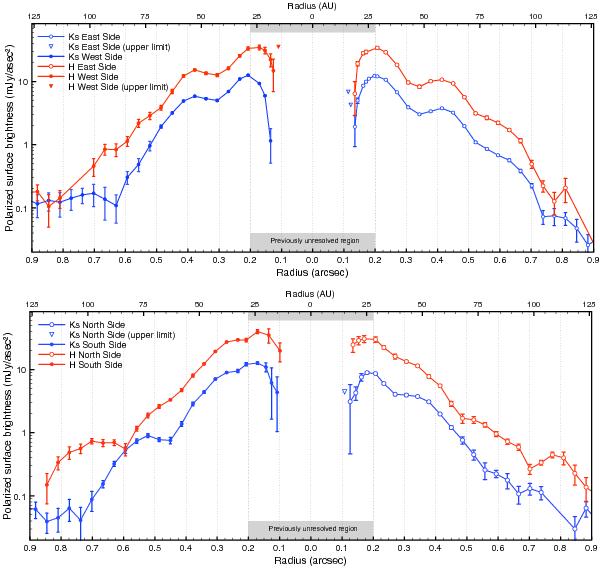
Radial profile of the polarized surface brightness. Top: along the major axis in NE (right half) and in SW (left half) direction for H (red) and Ks band (blue). Bottom: along the minor axis in NW (right half) and in SE (left half) direction, namely the far and near disk side, respectively. The grey box indicates the region that our data resolved for the first time. In all profiles (except the H band NW minor axis), the depletion inside this region is evident. Errors are 3σ noise calculated from the P∥ images (see Sect. 2) and do not include systematic uncertainties in the photometric calibration.
Current usage metrics show cumulative count of Article Views (full-text article views including HTML views, PDF and ePub downloads, according to the available data) and Abstracts Views on Vision4Press platform.
Data correspond to usage on the plateform after 2015. The current usage metrics is available 48-96 hours after online publication and is updated daily on week days.
Initial download of the metrics may take a while.