Fig. 9
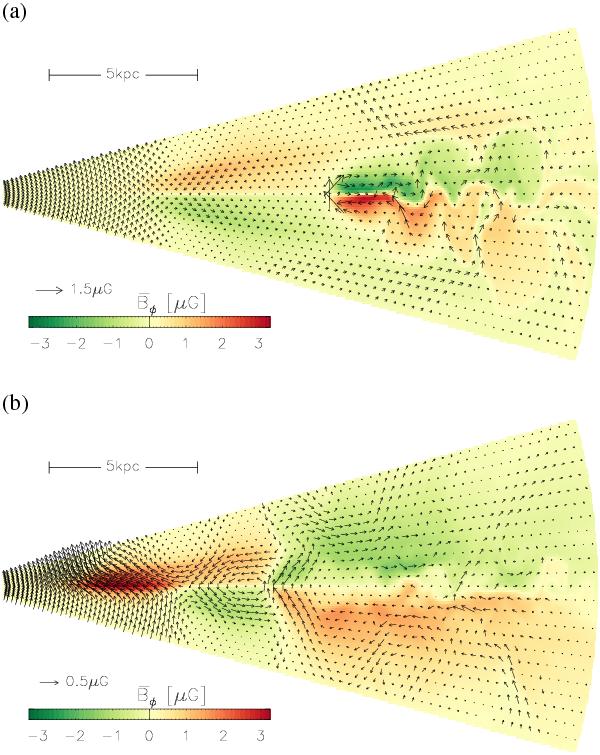
Poloidal cuts through model N3d-VF, with colour-coded
 and vectors indicating the in-plane field. Panel a), at
t = 2.7 Gyr, shows the initial A0 mode and strong fields
created by the combined action of MRI and convection outside
R ≃ 10 kpc. In panel b), at
t = 3.9 Gyr, the S0 appears, and MRI is now somewhat weaker.
and vectors indicating the in-plane field. Panel a), at
t = 2.7 Gyr, shows the initial A0 mode and strong fields
created by the combined action of MRI and convection outside
R ≃ 10 kpc. In panel b), at
t = 3.9 Gyr, the S0 appears, and MRI is now somewhat weaker.
Current usage metrics show cumulative count of Article Views (full-text article views including HTML views, PDF and ePub downloads, according to the available data) and Abstracts Views on Vision4Press platform.
Data correspond to usage on the plateform after 2015. The current usage metrics is available 48-96 hours after online publication and is updated daily on week days.
Initial download of the metrics may take a while.