Fig. 5
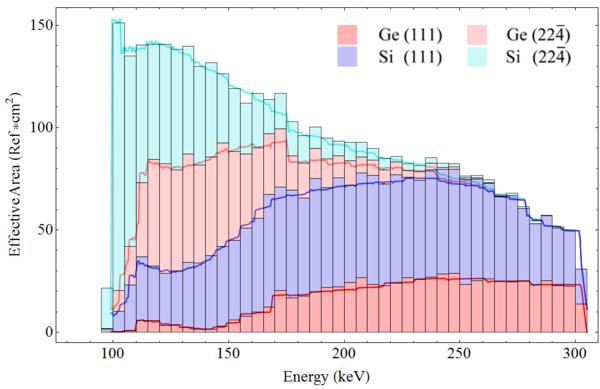
Effective area per unit energy of the lens. The contributions of the tiles of different species is visible. Tiles were positioned in the lens to maximize effective area in the energy range 100–300 keV and made the profile as smooth as possible with respect to energy variation. The histogram is calculated analytically, while the continuous lines are calculated with a Monte Carlo simulation.
Current usage metrics show cumulative count of Article Views (full-text article views including HTML views, PDF and ePub downloads, according to the available data) and Abstracts Views on Vision4Press platform.
Data correspond to usage on the plateform after 2015. The current usage metrics is available 48-96 hours after online publication and is updated daily on week days.
Initial download of the metrics may take a while.