Fig. 3
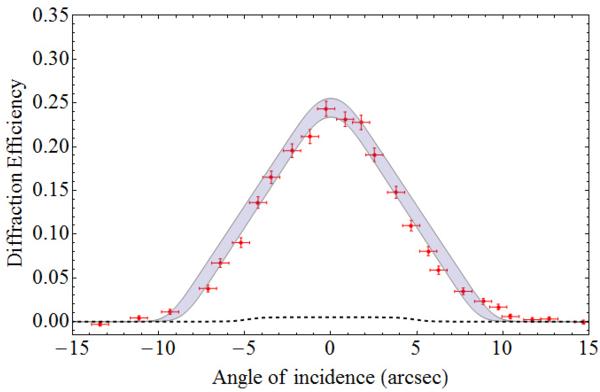
Experimental and theoretical RCs of a [22 ] QM crystal cylindrically bent. Red crosses plot the intensity of the measured diffracted beam with their uncertainty bar. The gray area represents the expected result as calculated by taking into account the experimental uncertainties. The dashed black line represents the diffraction efficiency without the QM curvature.
Current usage metrics show cumulative count of Article Views (full-text article views including HTML views, PDF and ePub downloads, according to the available data) and Abstracts Views on Vision4Press platform.
Data correspond to usage on the plateform after 2015. The current usage metrics is available 48-96 hours after online publication and is updated daily on week days.
Initial download of the metrics may take a while.