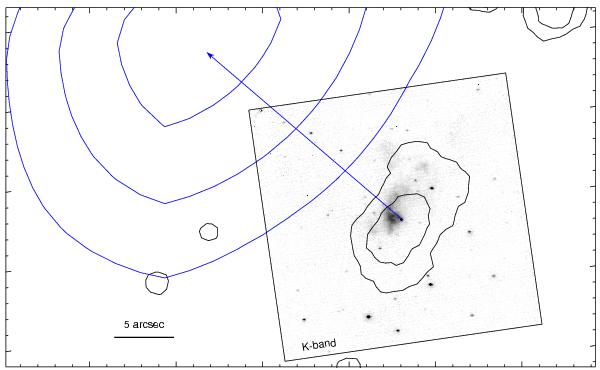
Fig. 4

The box shows the field observed with Gemini-NIRI and displays the broad Ks-band emission. The blue contours are the blueshifted CO outflow found by Ortega et al. (2012) and the black ones represent the 4.5 μm IRAC emission that delimits the EGO G45.47+0.05 boundaries. The angular resolution of the CO emission is about 20′′. The blue arrow shows the alignment between the structure that connects the IR source with the near-IR arc-like features and the blueshifted CO outflow.
Current usage metrics show cumulative count of Article Views (full-text article views including HTML views, PDF and ePub downloads, according to the available data) and Abstracts Views on Vision4Press platform.
Data correspond to usage on the plateform after 2015. The current usage metrics is available 48-96 hours after online publication and is updated daily on week days.
Initial download of the metrics may take a while.


