Fig. 4
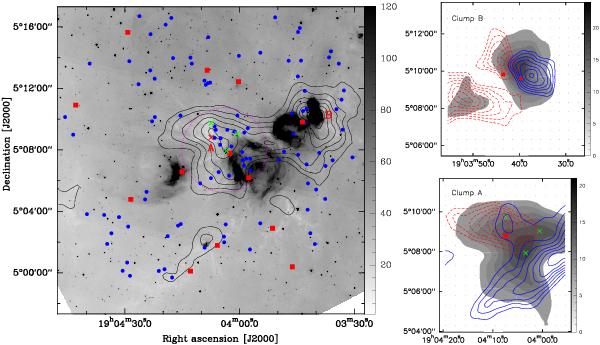
Left: Class I sources are labeled as blue dots. The red squares represent IRAS sources. The green and red crosses indicate five submm continuum sources. The purple dashed circle outlines the Class I sources, which may be associated with IRDC G38.95-0.47. Right: the velocity-integrated intensity maps of 13CO J = 1−0 outflows (red and blue contours) overlaid with the 13CO J = 1−0 emission of each clump (gray scale). The red and blue contour levels are 30,...,100% of the peak value. The red triangle represents a Class II methanol maser ((Deharveng et al. 2010).
Current usage metrics show cumulative count of Article Views (full-text article views including HTML views, PDF and ePub downloads, according to the available data) and Abstracts Views on Vision4Press platform.
Data correspond to usage on the plateform after 2015. The current usage metrics is available 48-96 hours after online publication and is updated daily on week days.
Initial download of the metrics may take a while.