Fig. 1
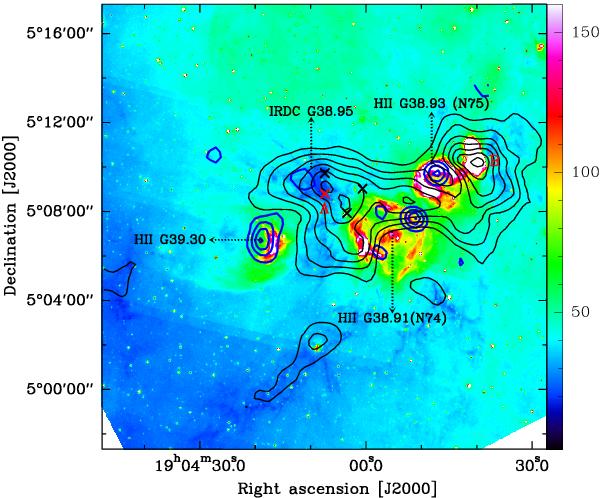
13CO J = 1−0 integrated intensity contours (black) and 1.4 GHz radio continuum emission contours (blue) overlaid on the Spitzer-IRAC 8 μm emission map (color scale). The black contour levels are 30, 40,..., 90% of the peak value (46.7 K km s-1). The blue contour levels are 1.7, 3.3, 4.9, 6.5, and 8.1 mJy beam-1. The letters A and B indicate the different cloud clumps. The green and red crosses indicate four millimeter continuum sources.
Current usage metrics show cumulative count of Article Views (full-text article views including HTML views, PDF and ePub downloads, according to the available data) and Abstracts Views on Vision4Press platform.
Data correspond to usage on the plateform after 2015. The current usage metrics is available 48-96 hours after online publication and is updated daily on week days.
Initial download of the metrics may take a while.