Fig. A.1
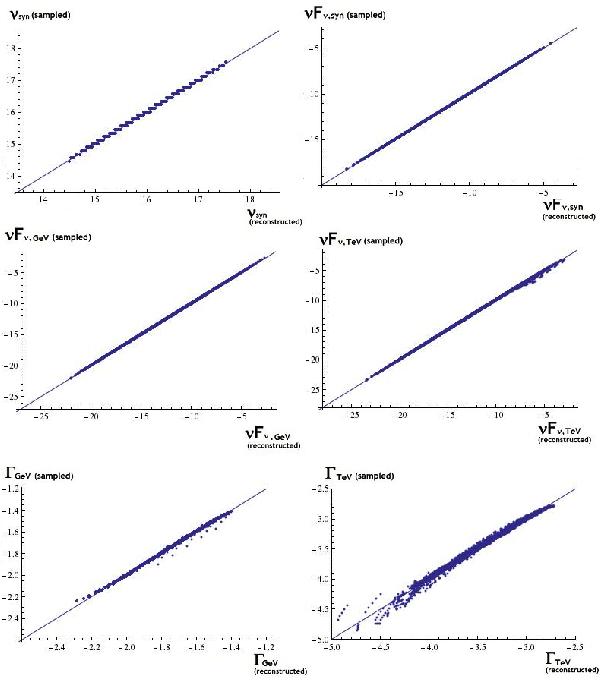
Comparison between the sampled values of the six observables considered in this study and their reconstructed values, expressed as a function of the SSC-model parameters, for the case of 1RXS J101015.9 - 311909. In a perfect fit, the points would follow a linear relation (thin solid line). The six subplots are in the order (from top to bottom, and left to right), the synchrotron peak frequency (νs), the synchrotron peak flux (expressed as νFν;s), the Fermi flux (measured at the decorrelation energy and expressed as νFν;GeV), the H.E.S.S. flux (measured at the decorrelation energy and expressed as νFν;TeV), the measured Fermi photon index (ΓGeV), and the measured H.E.S.S. photon index (ΓTeV).
Current usage metrics show cumulative count of Article Views (full-text article views including HTML views, PDF and ePub downloads, according to the available data) and Abstracts Views on Vision4Press platform.
Data correspond to usage on the plateform after 2015. The current usage metrics is available 48-96 hours after online publication and is updated daily on week days.
Initial download of the metrics may take a while.