Fig. 4
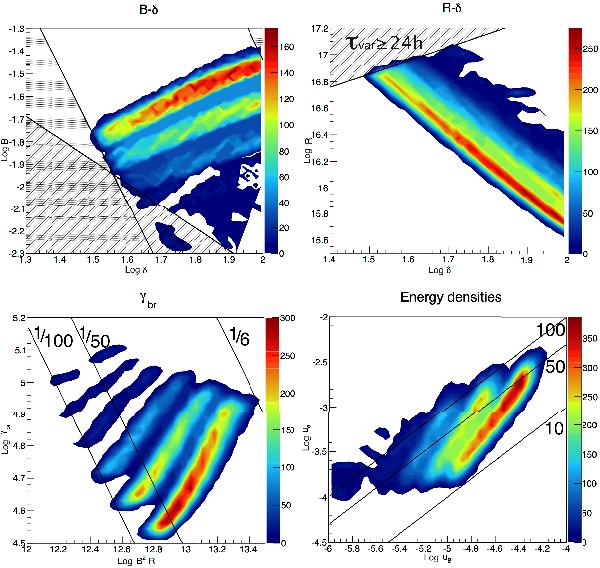
Contour plots of the solutions found for 1RXS J101015.9 - 311909. The contours are expressed in arbitrary units representing the number of solutions corresponding to a given pair of parameters. White represents zero. As discussed in Sect. 2, the most extended contour corresponds to a 1-σ contour with respect to the best-fit solution, as determined a posteriori. Top left: contours in the B–δ plane. The shadowed regions represent the exclusion regions defined following T98 (the region filled with diagonal lines is computed from Eq. (4), while the region filled with dots is computed from Eq. (11), considering an emitting region size equal to (1 + z)cτvar/δ and (1 + z)cτvar/30δ). We do not include the constraint on the consistency of γbreak with synchrotron cooling). Top right: contours in the R–δ plane. The filled region corresponds to a variability time-scale higher than 24 h. Bottom left: contours in the γbreak–B2R plane. The black lines represent the expected value of γbreak in the presence of pure synchrotron cooling, assuming a value of βesc equal to (from left to right) 1/100, 1/50, and 1/6. Bottom right: contours in the ue–uB plane. The black lines correspond to ue/uB values equal to (from bottom to top) 10, 50, and 100, respectively.
Current usage metrics show cumulative count of Article Views (full-text article views including HTML views, PDF and ePub downloads, according to the available data) and Abstracts Views on Vision4Press platform.
Data correspond to usage on the plateform after 2015. The current usage metrics is available 48-96 hours after online publication and is updated daily on week days.
Initial download of the metrics may take a while.