Fig. 1
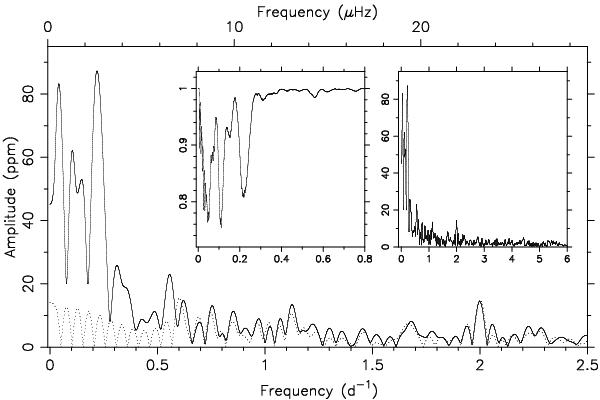
Outcome of the frequency analysis for the CoRoT light curve of HD 46769. The main panel shows the Scargle periodogram over [0,2.5] d-1 (full line) and the version after prewhitening with f = 0.0516 d-1 and seven of its harmonics as listed in Table 1 (dotted line). The left inset shows the Θ statistic and the right inset shows the Scargle periodogram over [0,6] d-1. No significant power occurs at frequencies above 0.6 d-1, unless they are of instrumental origin (such as the peak near 2 d-1).
Current usage metrics show cumulative count of Article Views (full-text article views including HTML views, PDF and ePub downloads, according to the available data) and Abstracts Views on Vision4Press platform.
Data correspond to usage on the plateform after 2015. The current usage metrics is available 48-96 hours after online publication and is updated daily on week days.
Initial download of the metrics may take a while.